If this post is useful to you I kindly ask a minimal donation on Buy Me a Coffee. It shall be used to continue my Open Source efforts.
You can send me questions for the blog using this form and subscribe to receive an email when there is a new post.
I updated Open Trade Statistics to showcase the new Tabler for R and D3po packages.
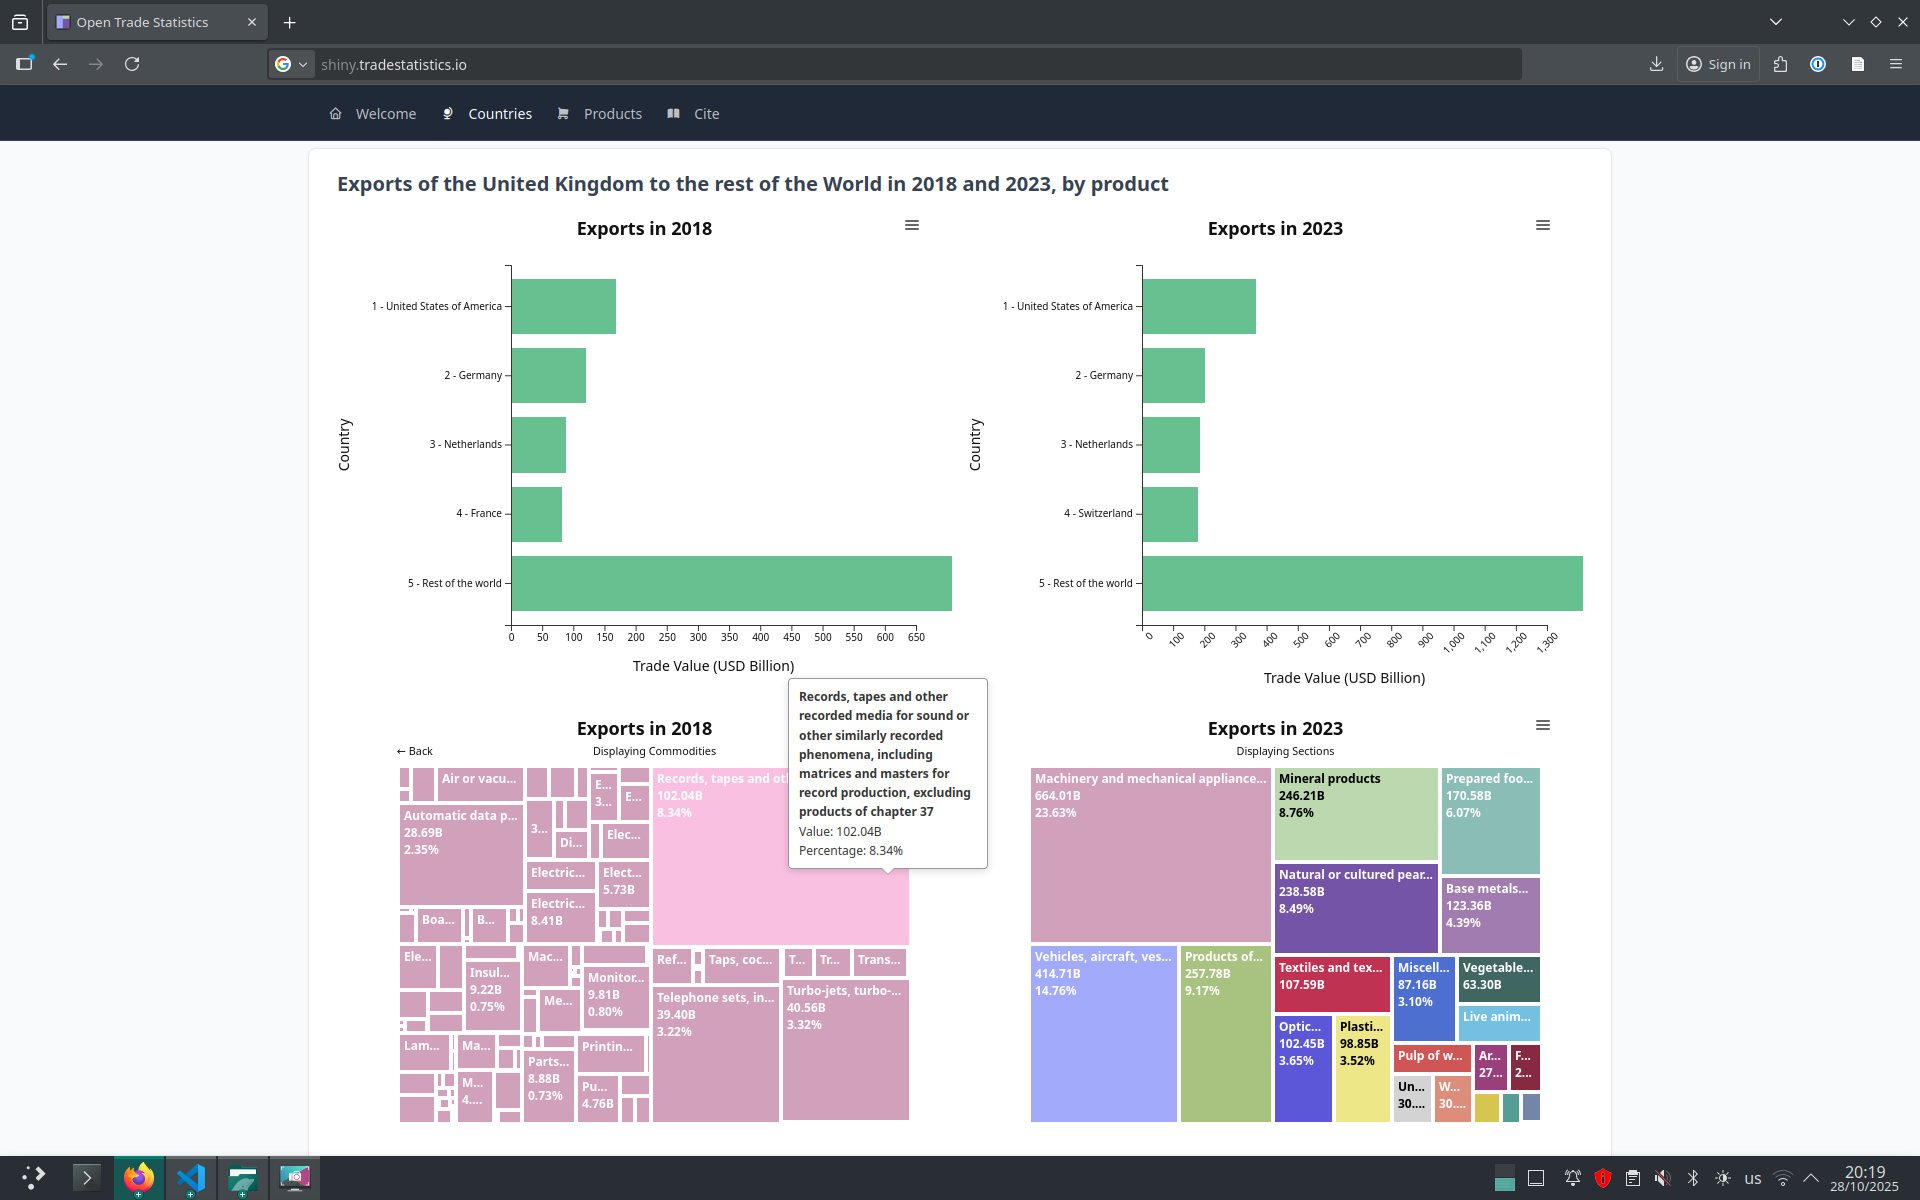
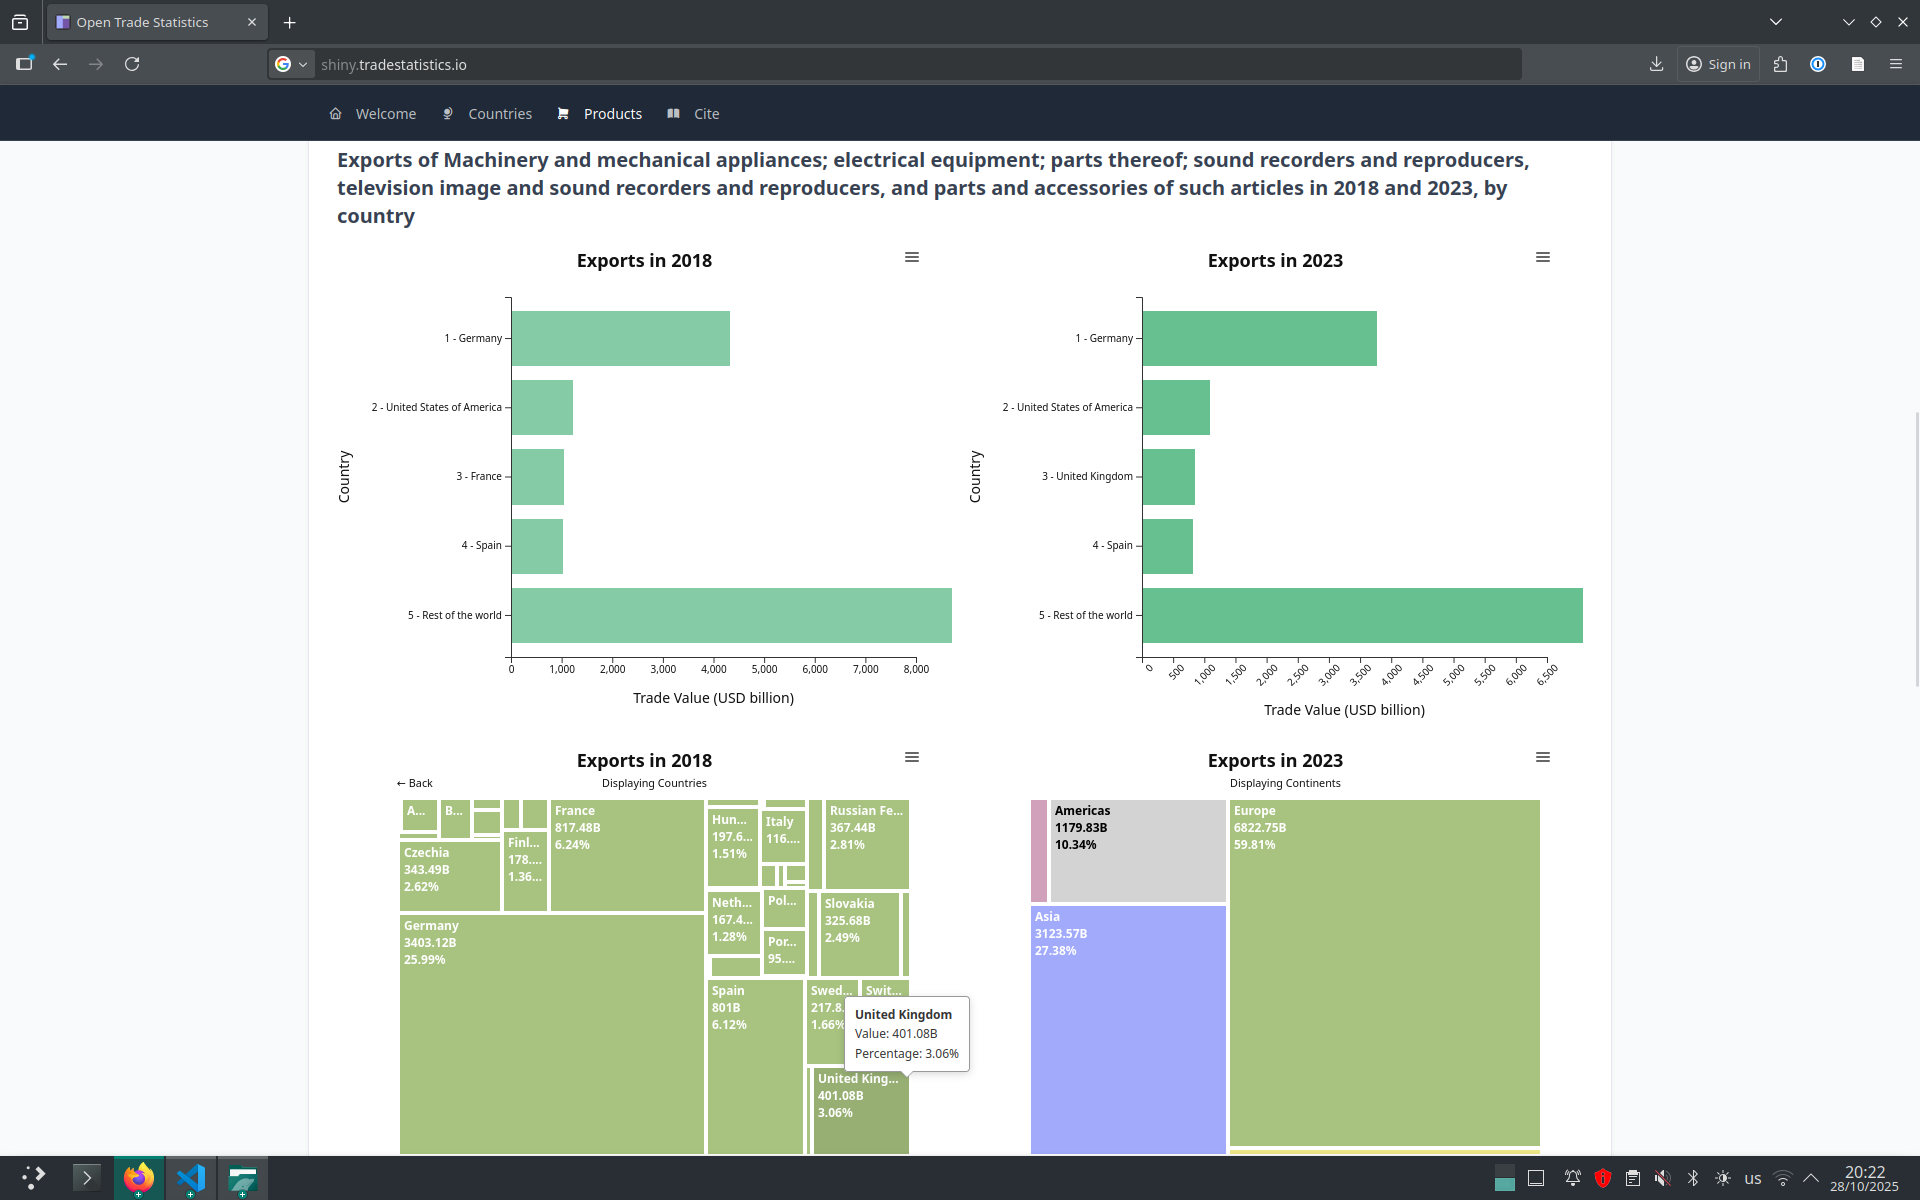
Recently, I updated Open Trade Statistics to include 2023 data derived from UN Comtrade.
While the data update was straightforward, I took the opportunity to revamp the dashboard using Tabler for R to enhance the user interface and D3po for interactive visualizations. One of the things I worked on, because I maintain both packages, was to ensure that building treemaps with D3po was as simple as possible.
Here is a screenshot of the updated dashboard:
While Highcharts requires a sophisticated code to render nested treemaps as an end user, D3po makes it easy with the po_treemap() function and moves the complexity to the package internals.
Here is an example of how to create a nested treemap with D3po (clicable):
Loading required package: htmlwidgets
Loading required package: magrittr
set.seed(123)

d <- data.frame(
  category = c(rep("Apples", 5), rep("Bananas", 4)),
  subcategory = c(
    "Fuji", "Gala", "Honeycrisp", "Granny Smith", "Other",
    "Cavendish", "Lady Finger", "Red Banana", "Other"
  ),
  stock = rpois(9, 100),
  color = c(
    "#e44b5e", "#f26863", "#f98a5c", "#fbb07b", "#f9c1a2",
    "#feffc6", "#edffb9", "#e1ffaa", "#d5fdb8"
  )
)

d3po(d, width = 800, height = 600) %>%
    po_treemap(
        daes(size = stock, group = category, subgroup = subcategory, color = color, tiling = "squarify")
    )
Here are the downloaded SVG images from the treemap above (e.g., for R-Bloggers):
I hope it’s useful!