Updated on 2024-05-29: The Chromium installation uses different steps to make sure that it will work with Selenium.
R and Shiny Training: If you find this blog to be interesting, please note that I offer personalized and group-based training sessions that may be reserved through Buy me a Coffee. Additionally, I provide training services in the Spanish language and am available to discuss means by which I may contribute to your Shiny project.
Motivation
UN Comtrade is a great source of data for international trade. However, some countries report imports with a different convention than CIF (Cost, Insurance, and Freight), which is the standard for international trade. The same happens with exports, which are reported with a different convention than FOB (Free on Board).
In order to be aware of this and know which countries report with a different convention, we need to download the metadata for each country. This is a time-consuming task, as we need to download each country’s metadata one by one, because this information is not contained within UN Comtrade API, spreadsheets or bulk downloads in CSV.
A slightly more processed version of this data is available in my valuation system repository.
Installing RSelenium and Chrome/Chromium
We need to install RSelenium from the R console.
install.packages("RSelenium")

# or

remotes::install_github("ropensci/RSelenium")
Also we need to check that chrome or chromium is installed in our system. One of the many options (I’m on Pop OS, an Ubuntu derivative) is to use the bash console.
sudo add-apt-repository ppa:savoury1/chromium
sudo apt update
sudo apt install chromium-browser
sudo apt install chromium-chromedriver
Not using the PPA will install the snap version of Chromium, which is not compatible with Selenium in May 2024, or at least it did not not work when I followed my own post one year later.
Starting Selenium
If we try to start Selenium as it is mentioned in the official guide, it won’t work.
library(RSelenium)

rmDr <- remoteDriver(port = 4444L, browserName = "chrome")

rmDr$open(silent = TRUE)

Error in checkError(res) :
  Undefined error in httr call. httr output: Failed to connect to localhost port 4444 after 0 ms: Connection refused
This is because we also need to download Selenium standalone server. We can do this from the R console to download version 3.9.1 according to this solution on Stackoverflow.
url_jar <- "https://github.com/SeleniumHQ/selenium/releases/download/selenium-3.9.1/selenium-server-standalone-3.9.1.jar"
sel_jar <- "selenium-server-standalone-3.9.1.jar"

if (!file.exists(sel_jar)) {
  download.file(url_jar, sel_jar)
}
Now we need to run Selenium from a terminal. Because I use R from VS Code, I can open a bash tab alongside the R interactive tab, but there are many ways to do this. From the new bash tab we have to start Selenium.
java -jar selenium-server-standalone-3.9.1.jarNow we can control the browser from R.
library(RSelenium)

rmDr <- remoteDriver(port = 4444L, browserName = "chrome")

rmDr$open(silent = TRUE)

url <- "https://comtrade.un.org/db/mr/daExpNoteDetail.aspx?"

rmDr$navigate(url)
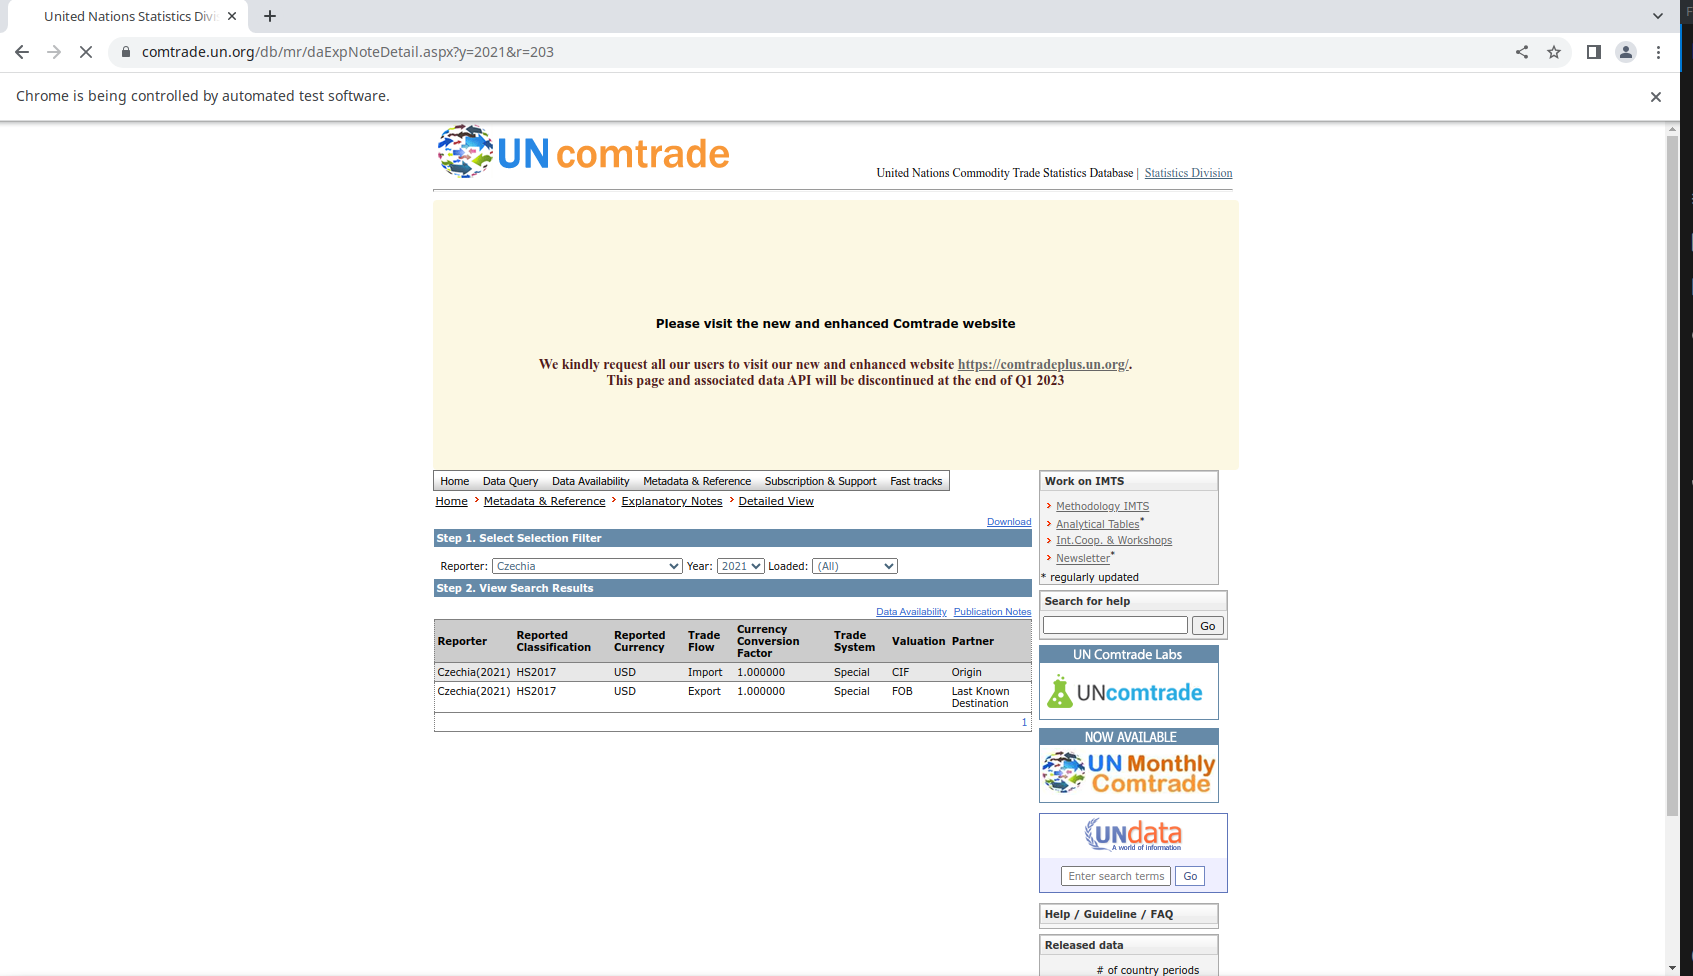
This should display a new Chrome/Chromium window that says “Chrome is being controlled by automated test software”.

Scraping the metadata
We can start by reading the html from the page with rvest. By inspecting the site (Ctrl + Shift + I), we can see which element we need to explore to obtain the countries from the “Reporter” dropdown menu.
library(rvest)
library(dplyr)

html <- read_html(rmDr$getPageSource()[[1]])

countries <- html %>%
  html_element(css = "select#cR_ddlR.InputText") %>%
  html_nodes("option") %>%
  html_text()
This also requires to understand the site navigation a bit. If we select Canada 2021, the URL changes to https://comtrade.un.org/db/mr/daExpNoteDetail.aspx?y=2021&r=124. This means that we can use the r parameter to select the country. We can also use the y parameter to select the year. Another thing to observe is that Canada reports imports as FOB, which is not the CIF standard for international trade.
In the dropdown, Canada is not the number 124 in the list, so we need to find the index of Canada in the list of countries.
ids <- html %>%
  html_element(css = "select#cR_ddlR.InputText") %>%
  html_nodes("option") %>%
  html_attr("value")
We can combine this into a single table.
countries <- tibble(
  country = countries,
  country_id = ids
)
From which we can create a vector or all reporters with a non-null id.
library(stringr)

R <- str_split(countries$country_id, ",")
R <- as.integer(unique(unlist(R)))
R <- R[!is.na(R)]
Now we can iterate with map and map_df to scrape the metadata for each country and each year.
library(purrr)
library(janitor)
library(readr)
library(glue)

try(dir.create("csv"))

fout <- glue("valuation_system.csv")

map(
  Y,
  function(y) {
    message(y)

    fout2 <- glue("csv/{y}.csv")

    new_table <- map_df(
      R,
      function(r) {
        print(r)

        url <- glue("https://comtrade.un.org/db/mr/daExpNoteDetail.aspx?y={y}&r={r}")
        rmDr$navigate(url)

        html2 <- read_html(rmDr$getPageSource()[[1]])

        table <- html2 %>%
          html_element(css = "table#dgXPNotes") %>%
          html_table(header = T) %>%
          clean_names() %>%
          mutate(
            r = r,
            y = y
          )

        # avoid ! Can't combine `..1$reporter` <integer> and `..2$reporter` <character>.
        table <- table %>%
          mutate_if(is.numeric, as.character)

        return(table)
      }
    )

    write_csv(new_table, fout2)
  }
)
Finally we combine all the tables into one.
valuation_system <- map_df(
  list.files("csv", full.names = T),
  function(x) {
    read_csv(x)
  }
)

glimpse(valuation_system)

Rows: 15,764
Columns: 10
$ reporter                   <chr> "Angola(1962)", "Angola(1962)", "Morocco(19…
$ reported_classification    <chr> "SITC Rev.1", "SITC Rev.1", "SITC Rev.1", "…
$ reported_currency          <chr> "PTE", "PTE", "MAD", "MAD", "MMK", "MMK", "…
$ trade_flow                 <chr> "Import", "Export", "Import", "Export", "Im…
$ currency_conversion_factor <dbl> 0.034780, 0.034780, 0.197600, 0.197600, 0.2…
$ trade_system               <chr> "Special", "Special", "Special", "Special",…
$ valuation                  <chr> "CIF", "FOB", "CIF", "FOB", "CIF", "FOB", "…
$ partner                    <chr> "Origin", "Last Known Destination", "Origin…
$ r                          <dbl> 24, 24, 504, 504, 104, 104, 504, 504, 96, 9…
$ y                          <dbl> 1962, 1962, 1962, 1962, 1963, 1963, 1963, 1…

write_csv(valuation_system, fout)