remotes::install_github("pachadotdev/tintin")
A few examples using head trauma data from the comic itself.
R and Shiny Training: If you find this blog to be interesting, please note that I offer personalized and group-based training sessions that may be reserved through Buy me a Coffee. Additionally, I provide training services in the Spanish language and am available to discuss means by which I may contribute to your Shiny project.
Motivation
Can we easily access a colour palette that is not viridis? Yes, we can! I will show you how to use the tintin package to create colorful plots.
Here are the palette options:

Install tintin
You can install the development version of tintin like so:
Examples
How many types of injury we find in Tintin comic books? Let’s use dplyr to find out:
library(dplyr)
Attaching package: 'dplyr'The following objects are masked from 'package:stats':
filter, lagThe following objects are masked from 'package:base':
intersect, setdiff, setequal, unionlibrary(tintin)
tintin_head_trauma %>%
group_by(cause_of_injury) %>%
count() %>%
arrange(desc(n)) %>%
print(n = 29)# A tibble: 29 × 2
# Groups: cause_of_injury [29]
cause_of_injury n
<fct> <int>
1 Blow from a club 8
2 Explosion 4
3 Bullet injury 3
4 Car accident 3
5 Chloroform poisoning 3
6 Blow from a stick 2
7 Dehydration 2
8 Hit by a brick 2
9 Hitting a tree trunk 2
10 Hypoxemia 2
11 Avalanche 1
12 Blow from a billy club 1
13 Falling down stairs 1
14 Falling on ice 1
15 Fight with a lion 1
16 G-force 1
17 Gas poisoning 1
18 Hit by a board 1
19 Hit by a camel femur 1
20 Hit by a camera 1
21 Hit by a rake 1
22 Hit by a tree trunk 1
23 Hit by a whisky bottle 1
24 Punch 1
25 Struck by a giant apple 1
26 Struck by a sword 1
27 Struck by an oar 1
28 Struck by Snowy 1
29 Train accident 1How about we condense the data a bit? Let’s use forcats::fct_lump to group the injuries and obtain the five most common causes of injury:
library(forcats)

tintin_head_trauma %>%
  mutate(cause_of_injury = fct_lump(cause_of_injury, 5)) %>%
  filter(cause_of_injury != "Other") %>%
  group_by(cause_of_injury) %>%
  count() %>%
  arrange(desc(n))
# A tibble: 5 × 2
# Groups: cause_of_injury [5]
cause_of_injury n
<fct> <int>
1 Blow from a club 8
2 Explosion 4
3 Bullet injury 3
4 Car accident 3
5 Chloroform poisoning 3Now, let’s plot the number of injuries per year using ggplot2 but creating intervals for the loss of consciousness variable:
library(ggplot2)

dplot <- tintin_head_trauma %>%
  mutate(
    locs_interval = cut(
      loss_of_consciousness_severity,
      breaks = 5
    )
  ) %>%
  group_by(year, locs_interval) %>%
  count()

g <- ggplot(dplot) +
  geom_col(aes(x = as.factor(year), y = n, fill = locs_interval)) +
  theme_minimal(base_size = 13) +
  theme(axis.text.x = element_text(angle = 30)) +
  labs(x = "Year",
    y = "Number of injuries",
    fill = "Severity",
    title = "Tintin's Head Trauma")

g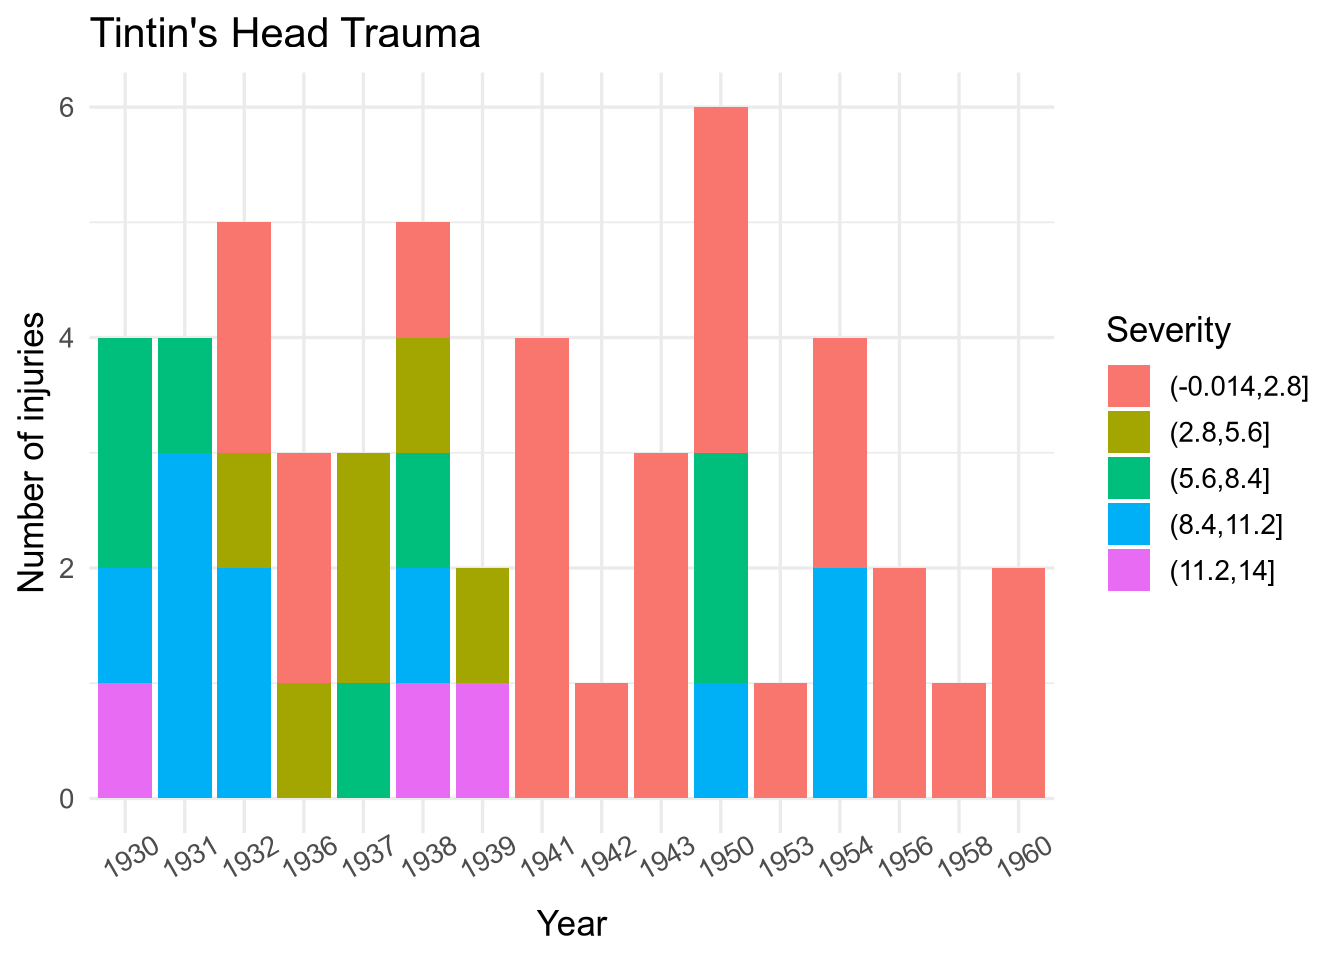
Now let’s use the tintin package to add colours:
# Top 3 books by count of injuries
tintin_head_trauma %>%
  group_by(book_title) %>%
  count() %>%
  arrange(desc(n)) %>%
  print(n = 3)
# A tibble: 16 × 2
# Groups: book_title [16]
book_title n
<fct> <int>
1 Land of Black Gold 6
2 The Black Island 5
3 Tintin in America 5
# ℹ 13 more rowsg +
scale_fill_tintin_d(option = "land_of_black_gold")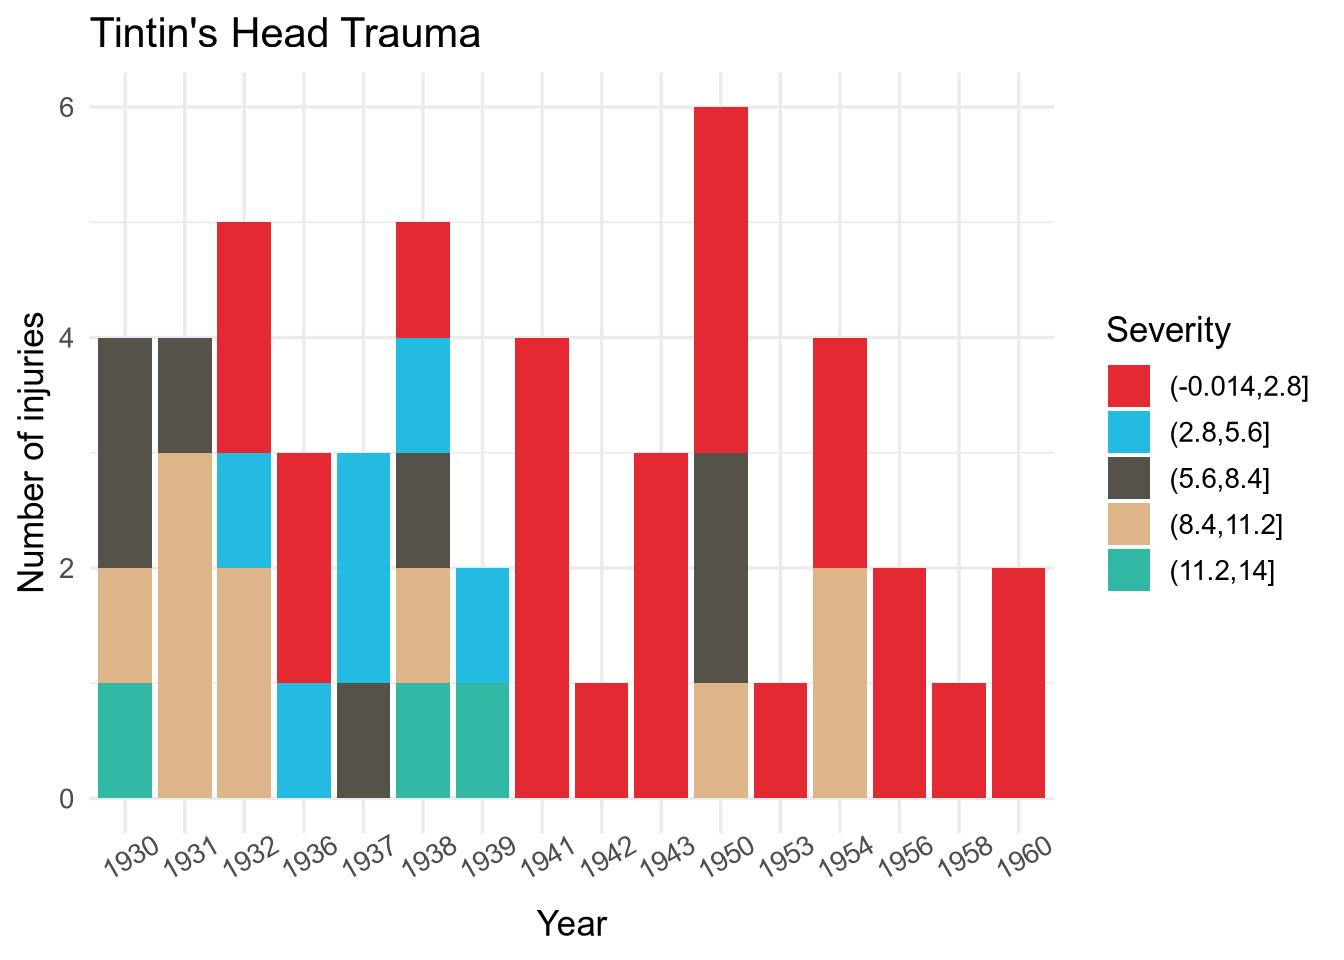
g +
  scale_fill_tintin_d(option = "the_black_island")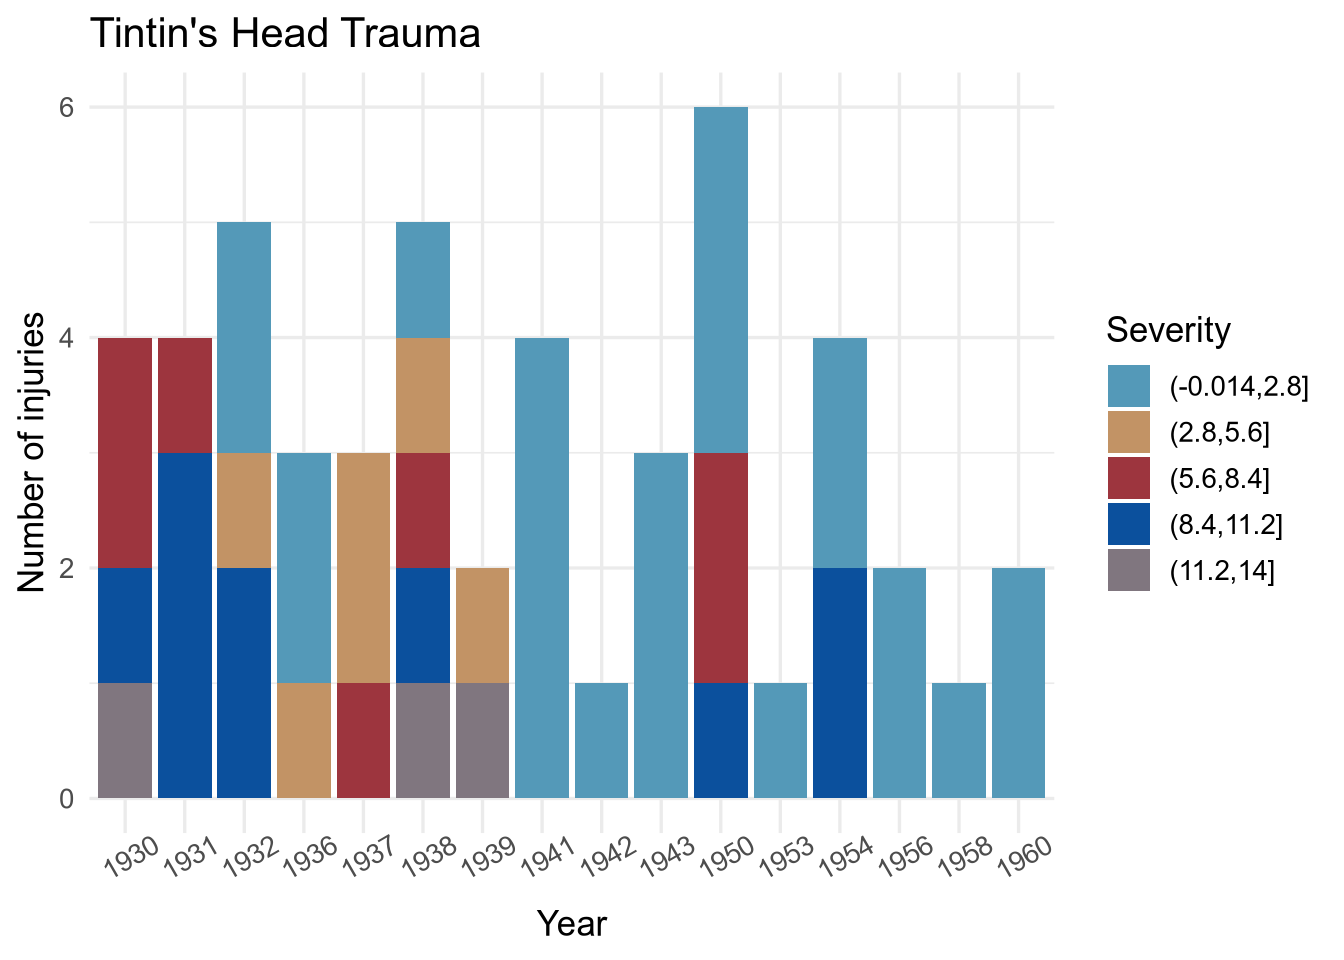
g +
  scale_fill_tintin_d(option = "tintin_in_america")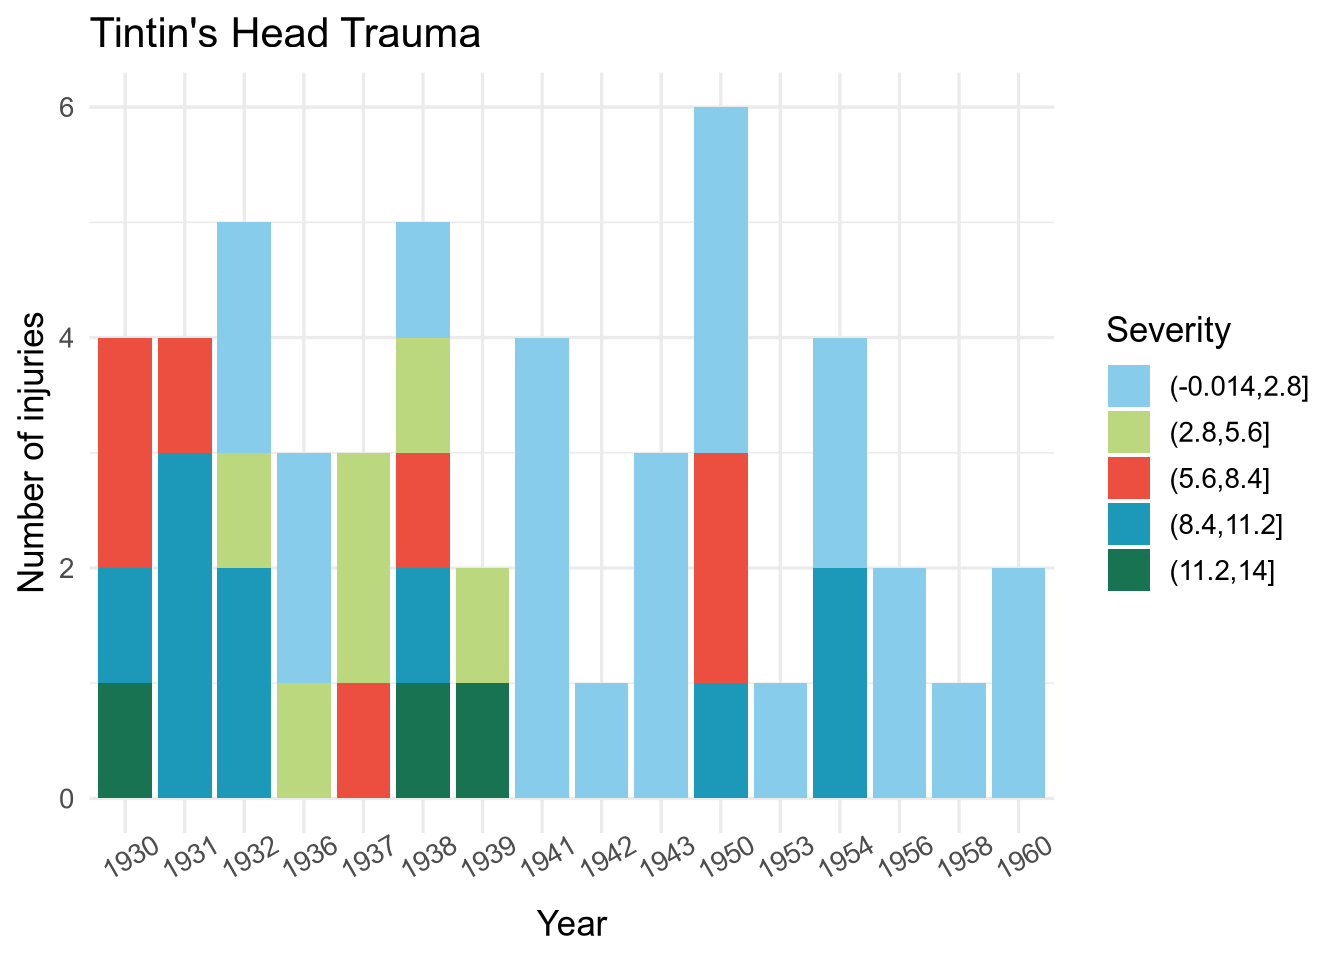
More examples
Check the package’s repository for more examples.