Updated 2022-05-28: Updated links.
About the bundle
Jodie Burchell and yours truly have published two books, The Hitchhiker’s Guide to Ggplot and The Hitchhiker’s Guide to Plotnine, on graphing in both R and Python using ggplot2 and plotnine, which are cross-language equivalents.
You can get the two books together for a special price if you buy The Hitchhiker’s Guide to Ggplot2 + The Hitchhiker’s Guide to Plotnine.
If you’d like to create highly customised plots, including replicating the styles of XKCD and also learning Python by doing what you do in R or viceversa, this is your combo!
This combo includes the R Markdown and Jupyter notebooks with all the exercises from the books.
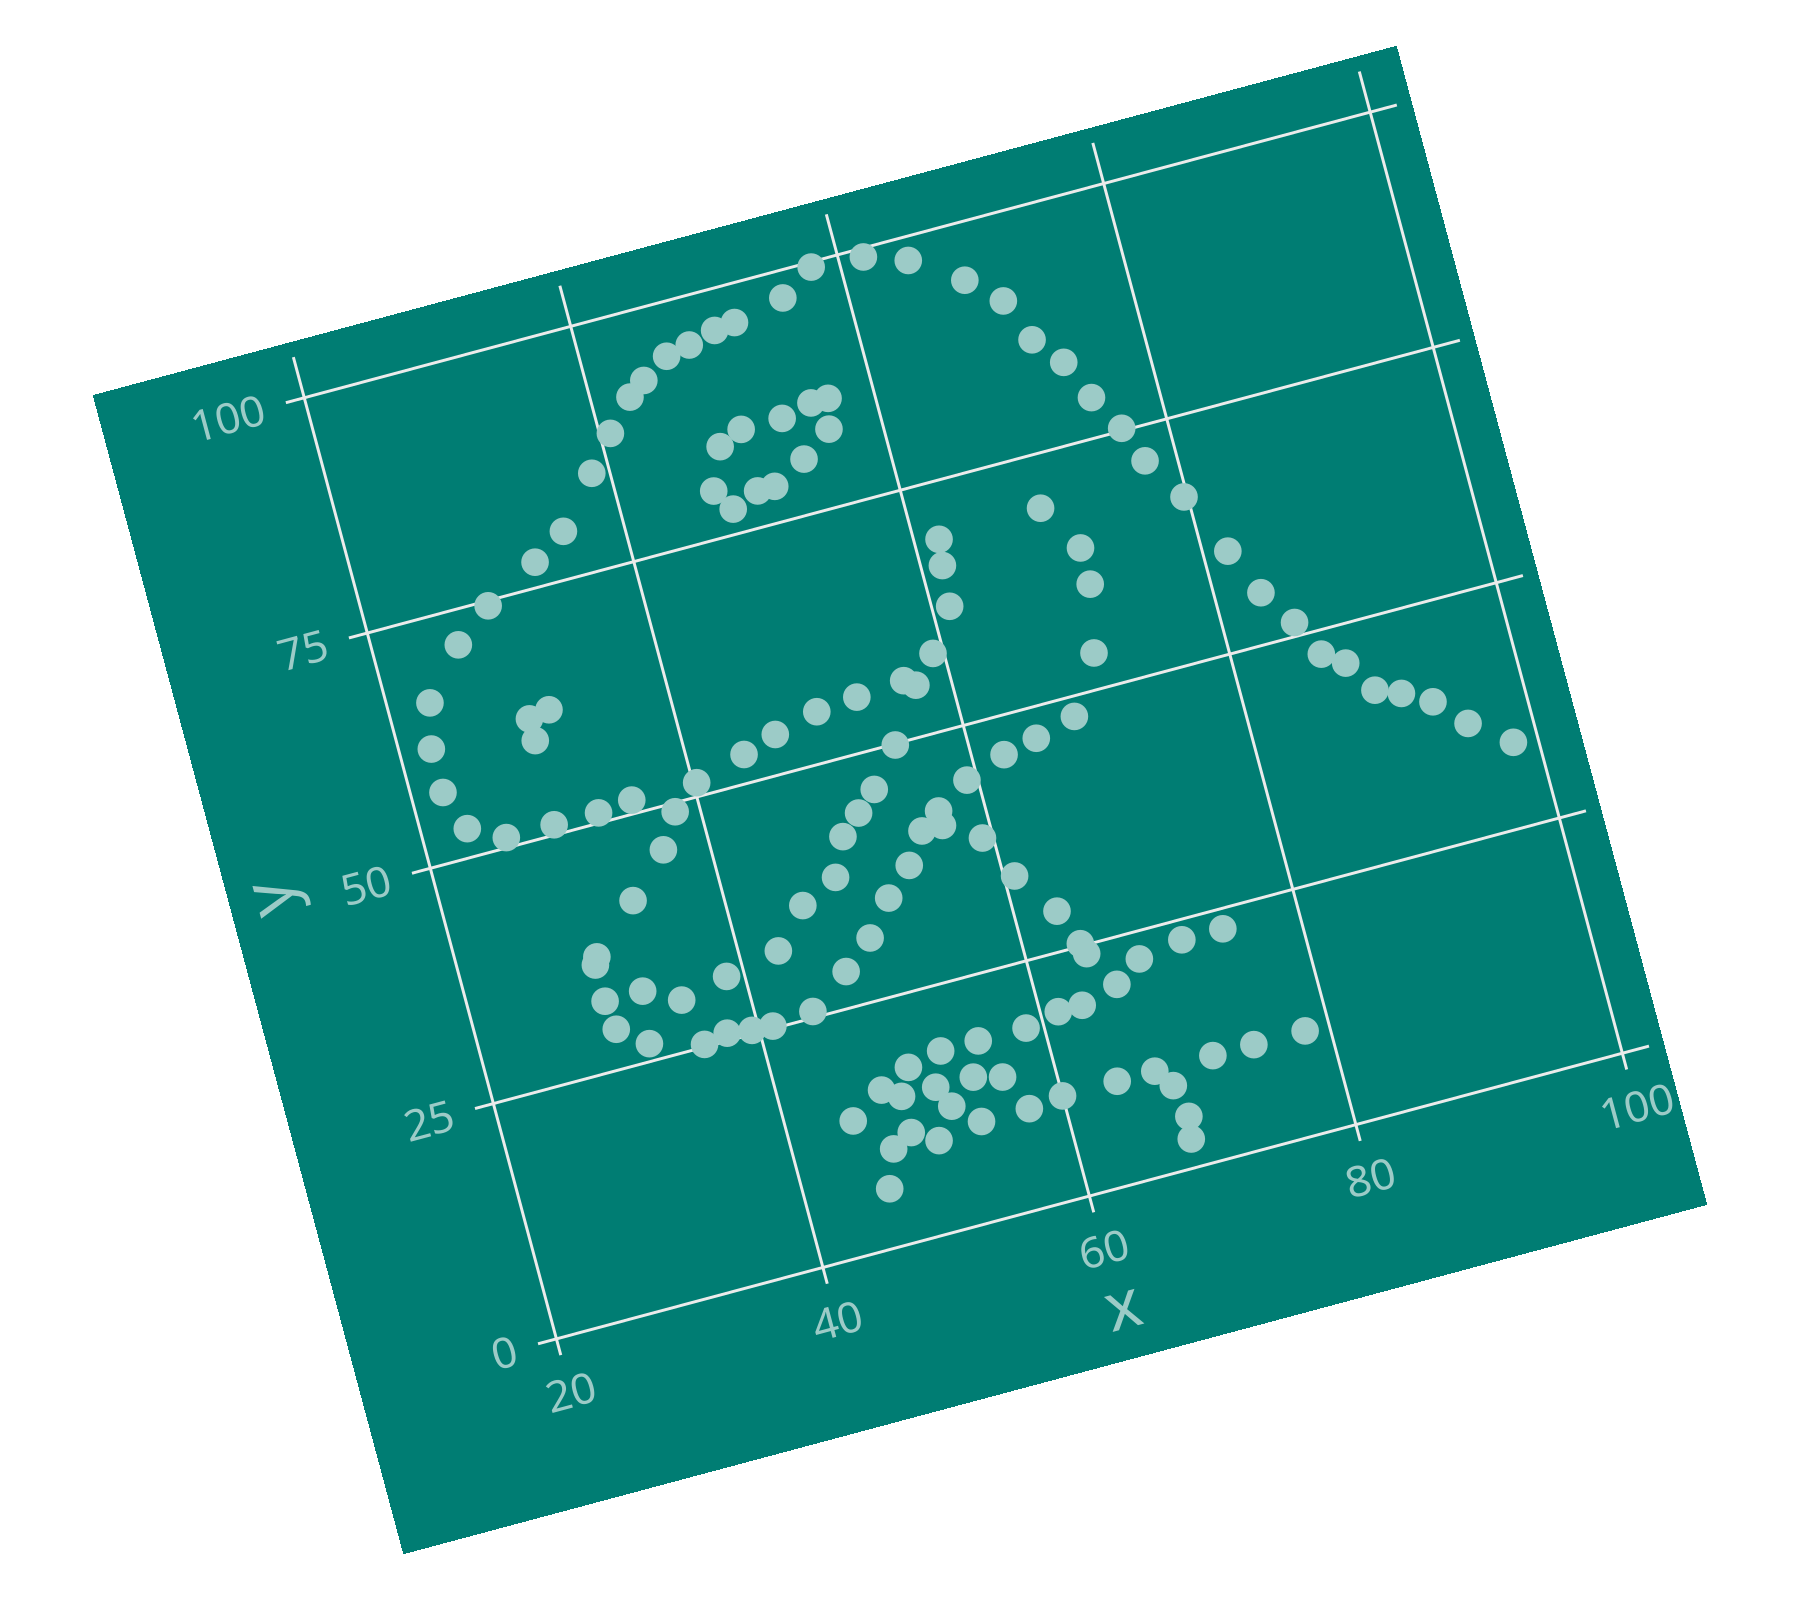
Here’s a part of the steps to create the covers:
library(dplyr)
library(ggplot2)
library(grid)
library(datasauRus)

g <- ggplot() +
  geom_point(
    data = filter(datasaurus_dozen, dataset == "dino"),
    aes(x = x, y = y), color = "#9ccbc7", size = 4
  ) +
  theme_minimal() +
  theme(
    plot.background = element_rect(fill = "#007d73"),
    axis.line = element_line(color = "#007d73"),
    panel.grid.minor = element_blank(),
    axis.ticks = element_line(color = "#007d73"),
    axis.text = element_text(color = "#9ccbc7",
                             family = "DecimaMonoPro",
                             size = 16),
    axis.title = element_text(color = "#9ccbc7",
                              family = "DecimaMonoPro",
                              size = 24)
  )

print(
  g,
  vp = viewport(
    angle = 15,
    width = unit(.75, "npc"),
    height = unit(.75, "npc")
  )
)