About the book
This book will help you master R plots the easy way, and this update works will recent versions of R packages. The book can be found at Leanpub.
We have spent a long time creating R plots with different tools (base, lattice and ggplot2) during different academic and working positions. If you want to create highly customised plots in R, including replicating the styles of XKCD, The Economist or FiveThirtyEight, this is your book.
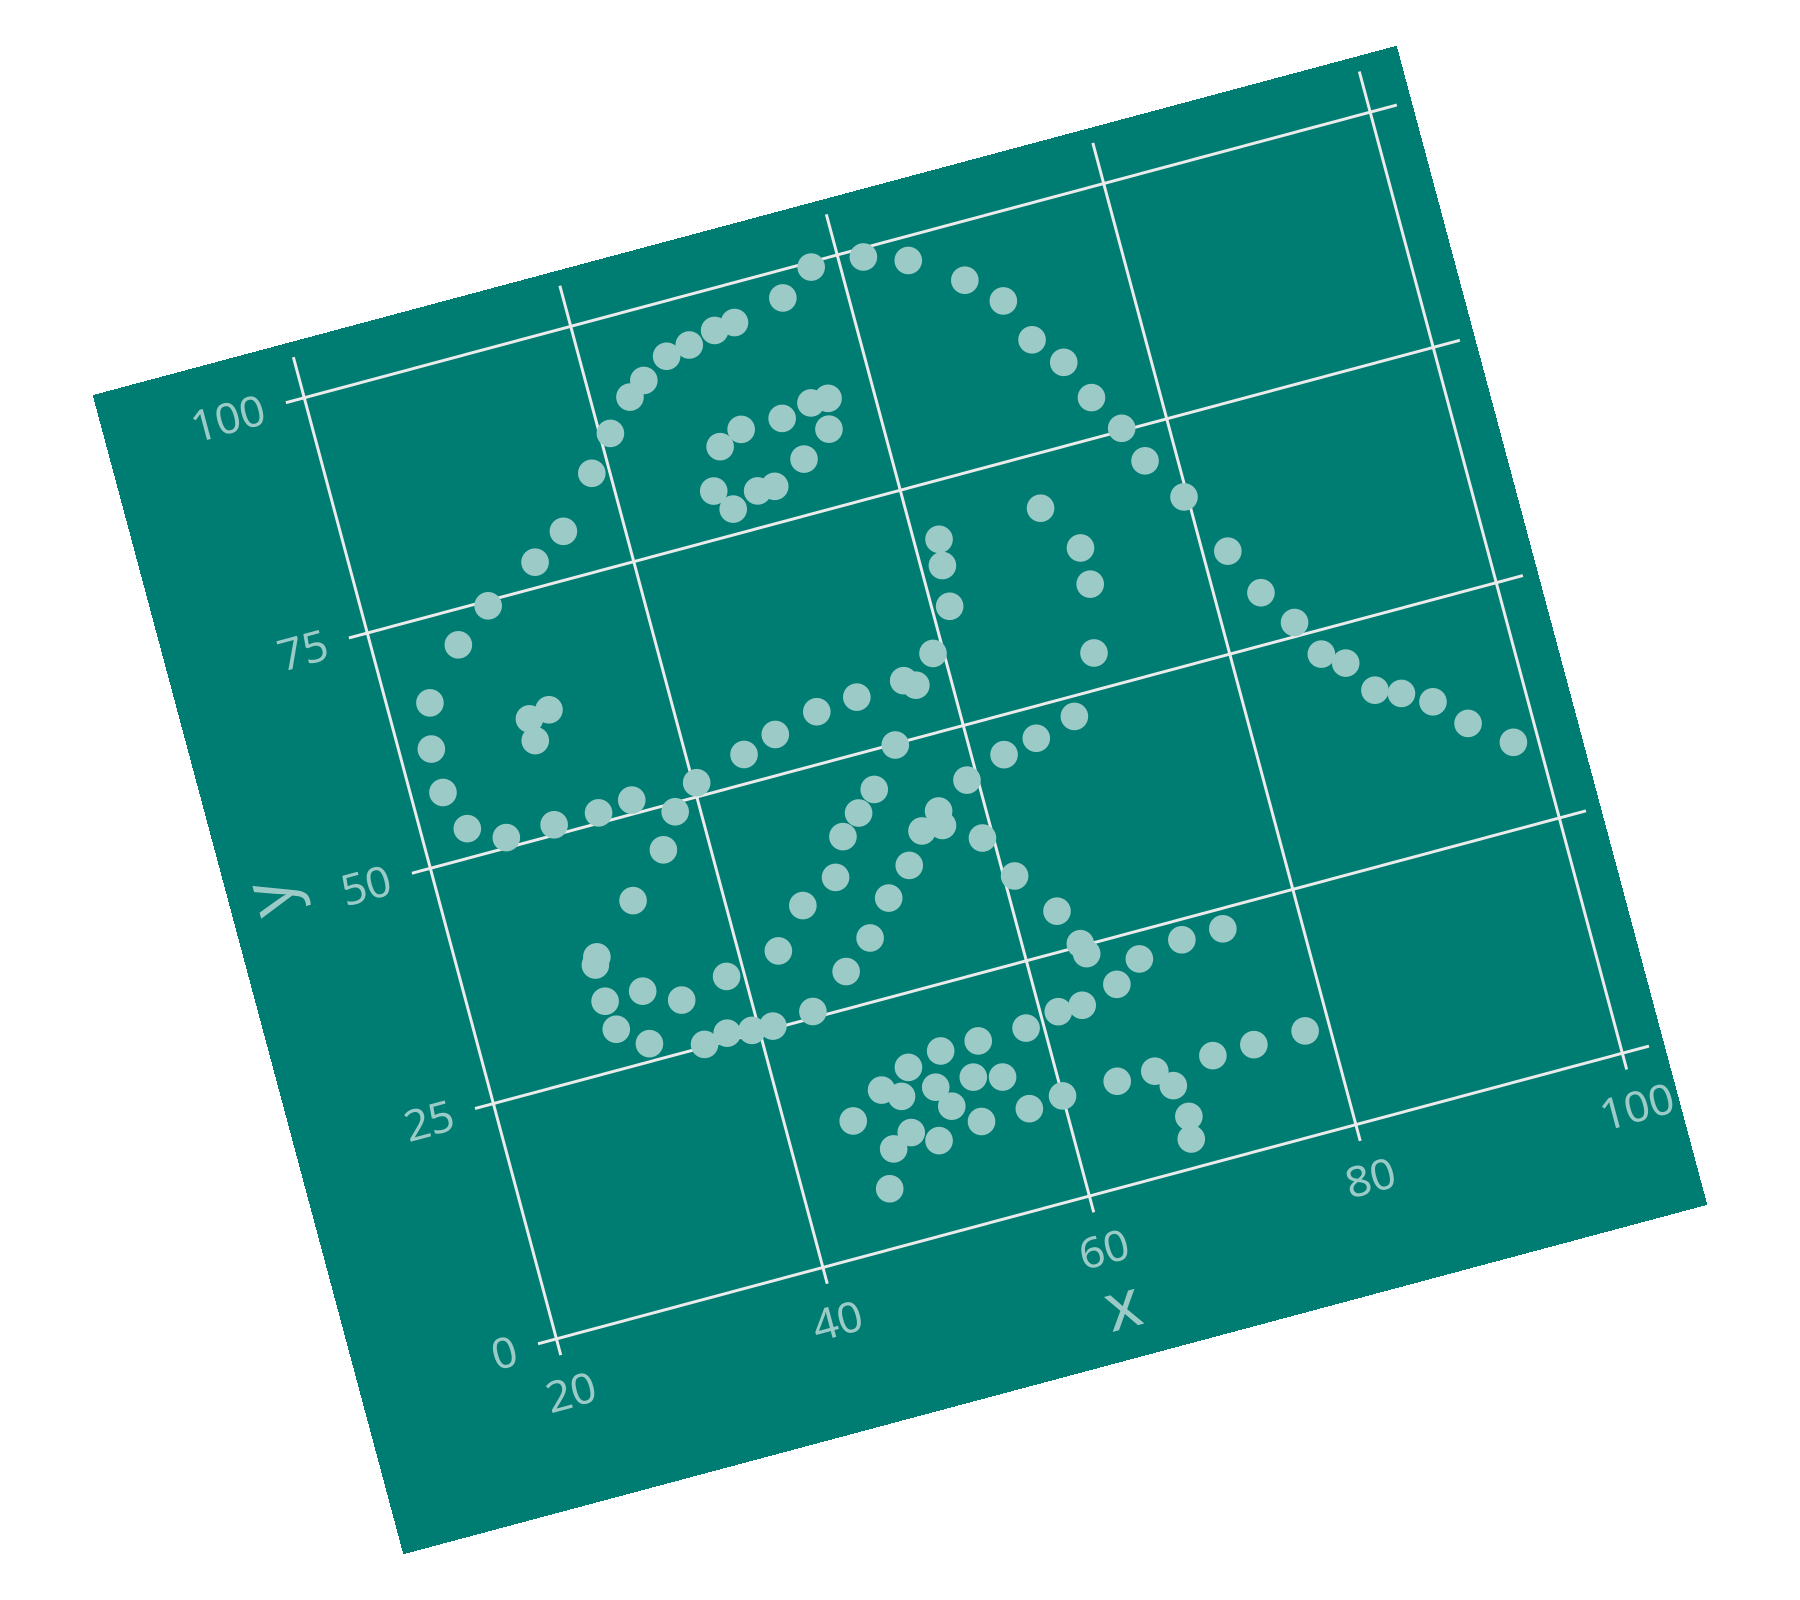
Here’s a part of the steps to create the cover:
if (!require(dplyr)) install.packages("dplyr")
if (!require(ggplot2)) install.packages("ggplot2")
if (!require(grid)) install.packages("grid")
if (!require(datasauRus)) install.packages("datasauRus")

library(dplyr)
library(ggplot2)
library(grid)
library(datasauRus)

g <- ggplot() +
  geom_point(
    data = filter(datasaurus_dozen, dataset == "dino"),
    aes(x = x, y = y), color = "#9ccbc7", size = 4
  ) +
  theme_minimal() +
  theme(
    plot.background = element_rect(fill = "#007d73"),
    axis.line = element_line(color = "#007d73"),
    panel.grid.minor = element_blank(),
    axis.ticks = element_line(color = "#007d73"),
    axis.text = element_text(color = "#9ccbc7",
                             family = "DecimaMonoPro",
                             size = 16),
    axis.title = element_text(color = "#9ccbc7",
                              family = "DecimaMonoPro",
                              size = 24)
  )

print(
  g,
  vp = viewport(
    angle = 15,
    width = unit(.75, "npc"),
    height = unit(.75, "npc")
  )
)