# sample returns a pseudo-random number x such that a <= x <= b
# example: return an integer "x" such that 1 <= x <= 10
set.seed(1717)
x <- sample(1:10, 1)

# for an envelope is quite similar
envelope <- sample(1:669, 5)

x
envelopeHow many sticker envelopes do I need to complete the FIFA World Cup album?
Motivation
To answer this there are two ways, being the first mathematical statistics that requires a considerable background, and the second is writing a code for a simulation. I’ll go fo the latter option.
The original article was written in spanish by @LNdata and features an excellent contribution by @fetnelio.
The original code was written in Python and here I am doing translation from spanish to english and from Python to R just out of curiosity.
A naive simulation
According to Wikipedia: “Simulation is the imitation of the operation of a real-world process or system. The act of simulating something first requires that a model be developed; this model represents the key characteristics, behaviors and functions of the selected physical or abstract system or process. The model represents the system itself, whereas the simulation represents the operation of the system over time.”
For this case, the simulation is about computing how many sticker envelopes (of five stickers each) are needed to complete a sticker album of 669 figures. This requieres a model that considers envelopes, stickers and the album.
Simulation consists in running many instances for a stochastic system, this is, a situation ruled by randomness or luck, as is the case of opening sticker envelopes without knowing beforehand which figures you’ll obtain. So I need a way to simulate the envelopes content as random by using a computational model.
Being this a naive simulation it is ok to use with pseudo-random numbers. In really simple terms a pseudo-random number generator is an algorithm based on a starting point called “seed” and this makes sampling results reproducible.
To model the envelope I’ ll use sample(sequence, elements) function, which takes \(k\) elements from a user defined sequence, in this case 5 numbers contained in the interval \([1, 669]\). The right way to extract these numbers is without replacement, this is, the envelopes do not contain repeted stickers.
Now I simulate an hypothetic envelope content:
[1] 7
[1] 114 638 155 268 468
I have to define some variables before going further:
envelope_figs <- 5
album_figs <- 669
iterations <- 1000
The result is sensitive to the number of iterations. As the number of iterations increases I expect the result to be more accurate, and I also expect the experiment to take a longer time.
I’ll register how many envelopes I need on each iteration:
# create an empty vector to store the results on it later
simulation_results <- rep(NA, iterations)
The next step is the simulation itself (it takes less than 5 minutes) with the repetitions defined as before:
for (i in 1:iterations) {
  # model the empty album as a vector of zeroes
  album <- rep(0, album_figs)

  # count the required envelopes
  envelopes_count <- 0

  # open envelopes until the album is completed
  # if any coordinate of the vector is zero it means the album is not complete
  # the incomplete album can be written in many ways
  # one possibility is length(album[album == 0]) > 0
  # another is min(album) == 0
  while (min(album) == 0) {
    envelope <- sample(1:album_figs, envelope_figs)

    # filling the album
    # add 1 at each position belonging to an obtained sticker
    album[envelope] <- 1
    envelopes_count <- envelopes_count + 1
  }

  simulation_results[i] <- envelopes_count
}
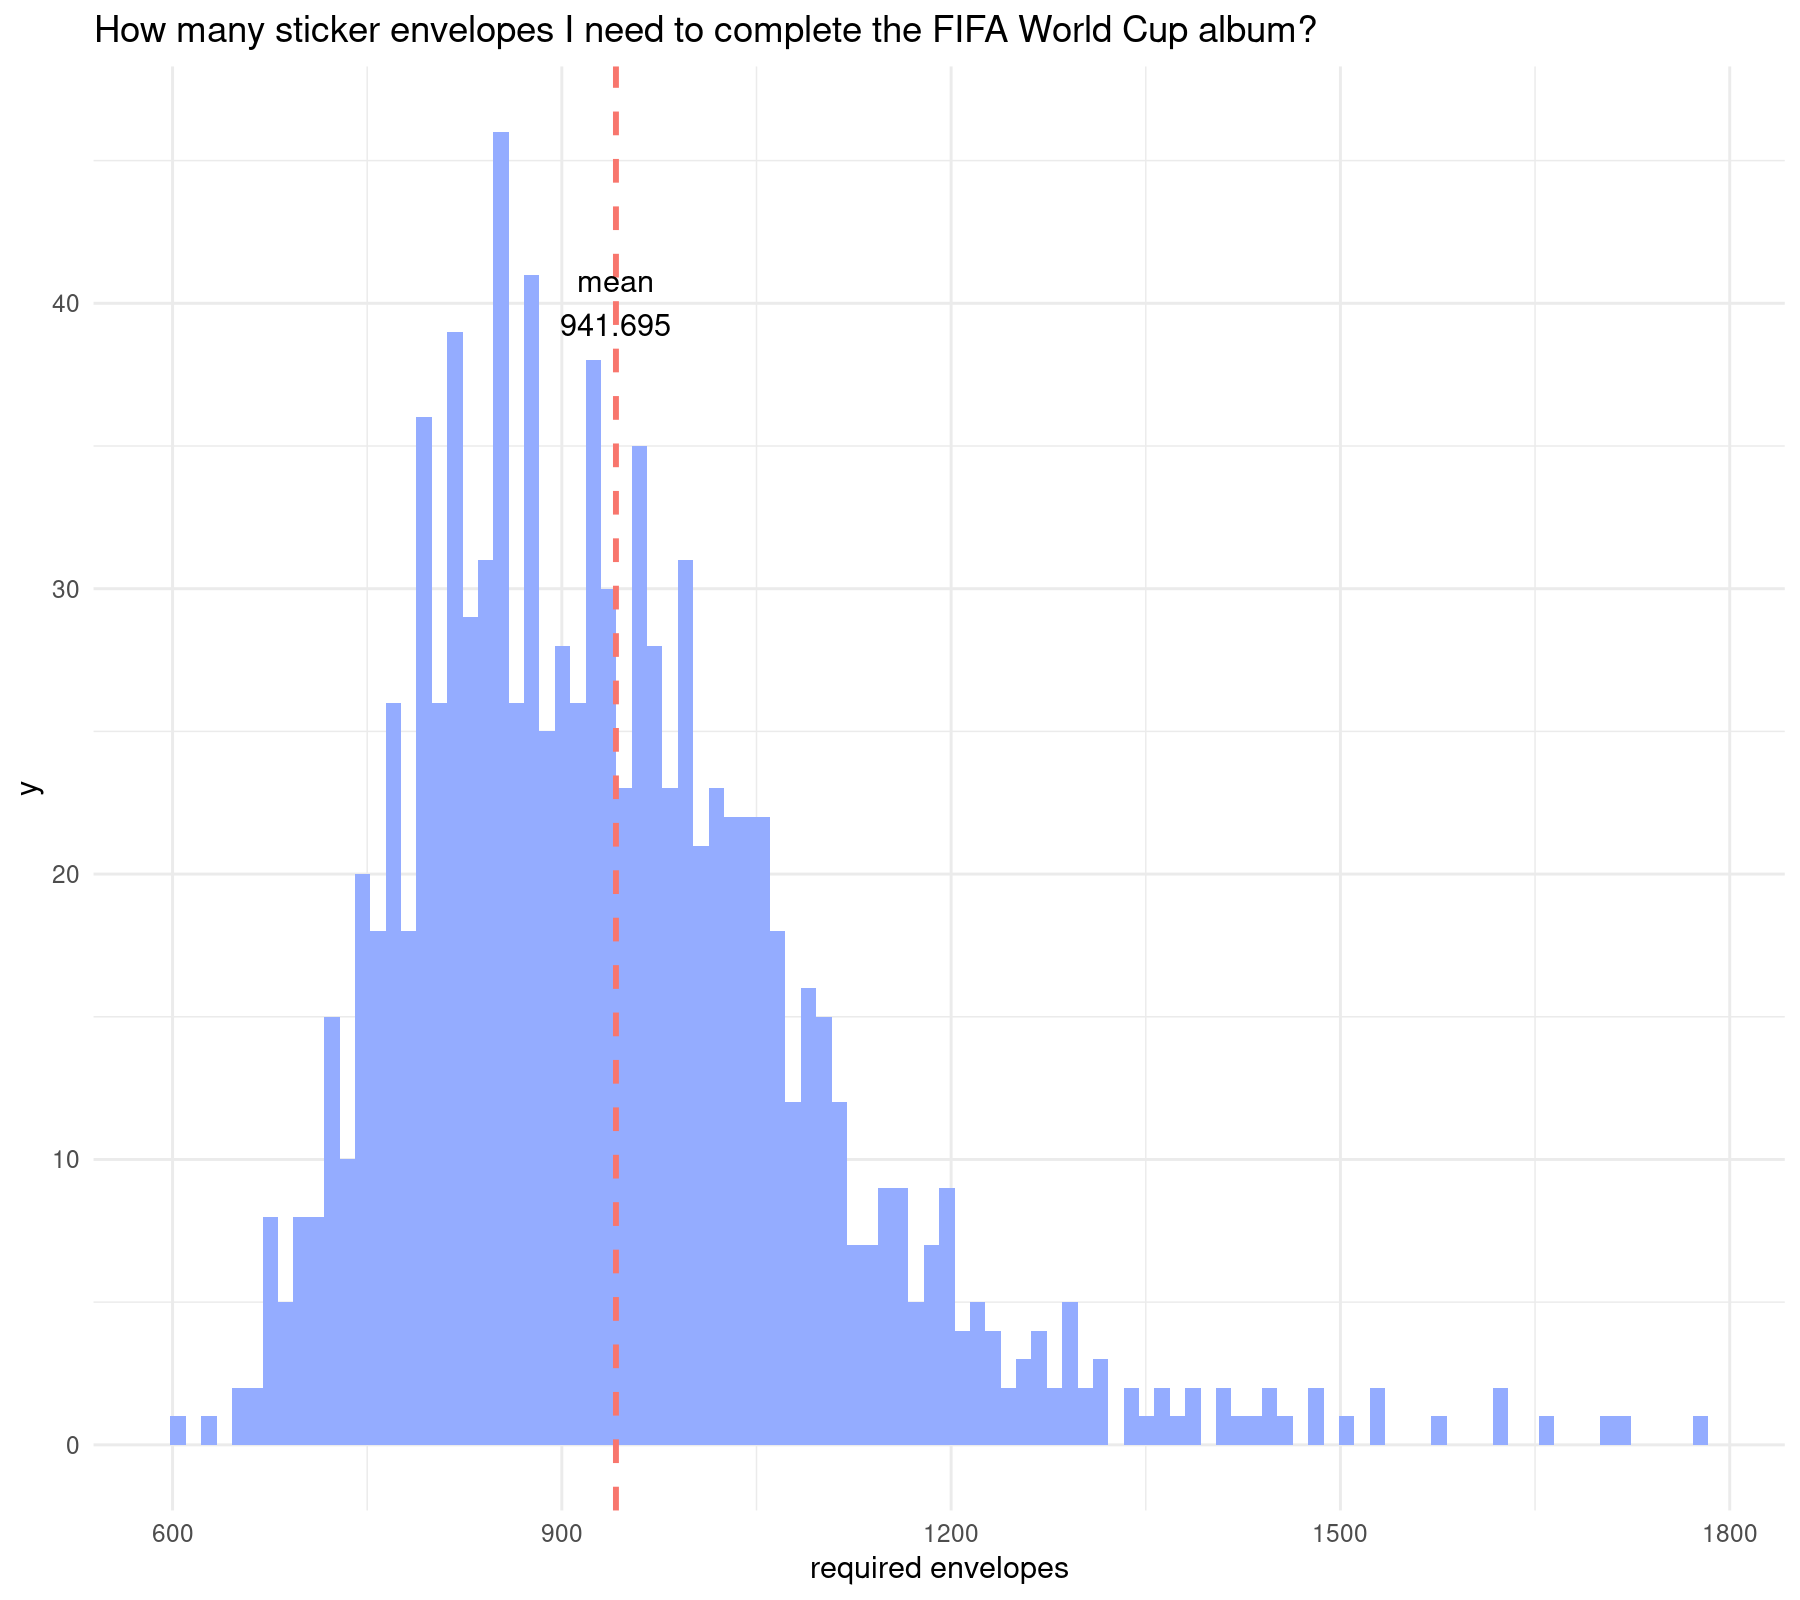
After running the experiment I have 1,000 observations. A histogram can represent this properly:
library(ggplot2)
library(dplyr)

simulation_results_2 <- tibble(required_envelopes = simulation_results)

ggplot(simulation_results_2, aes(x = required_envelopes)) +
  geom_histogram(bins = 100, fill = "#94acff") +
  geom_vline(aes(xintercept = mean(simulation_results), color = "mean"), linetype = "dashed", size = 1) +
  annotate("text", x = mean(simulation_results), y = 40, label = paste("mean", mean(simulation_results), sep = '\n')) +
  labs(x = "required envelopes") +
  theme_minimal() +
  theme(legend.position = "none") +
  ggtitle("How many sticker envelopes I need to complete the FIFA World Cup album?")
With a little help from my friends
The latter simulation indicates that I need around 940 sticker envelopes and I end up with around 4,000 repeated stickers. With that many repeated stickers I am close to complete a second and even a third album.
If I team up with friends, completing the album is cheaper and faster. How many sticker envelopes do I need to complete \(n\) albums?
Adding a new variable assuming I’ll complete the album with 20 friends:
n_albums <- 20Now the simulation will register how many envelopes are needed to complete \(1,2,\ldots,n\) albums:
simulation_results_3 <- matrix(NA, nrow = n_albums, ncol = iterations)Adding code over the last simulation (this is just following the original post and I’m not using parallelization) I can compute how many sticker envelopes are needed to complete \(n\) albums:
for (i in 1:n_albums) {
  for (j in 1:iterations) {
    # model the empty album as a vector of zeroes
    album <- rep(0, album_figs)

    # count the required envelopes
    envelopes_count <- 0

    # count complete albums
    complete_albums <- 0

    # open envelopes until the album is completed
    # if any coordinate of the matrix is zero it means not all albums are complete
    while (complete_albums < i) {
      envelope <- sample(1:album_figs, envelope_figs)

      # filling the album
      # add 1 at each position belonging to an obtained sticker
      album[envelope] <- album[envelope] + 1
      envelopes_count <- envelopes_count + 1

      # if min(album) increases, then a new album is completed
      if (complete_albums < min(album)) {
        complete_albums <- min(album)
        simulation_results_3[i, j] <- envelopes_count
      }
    }
  }
}
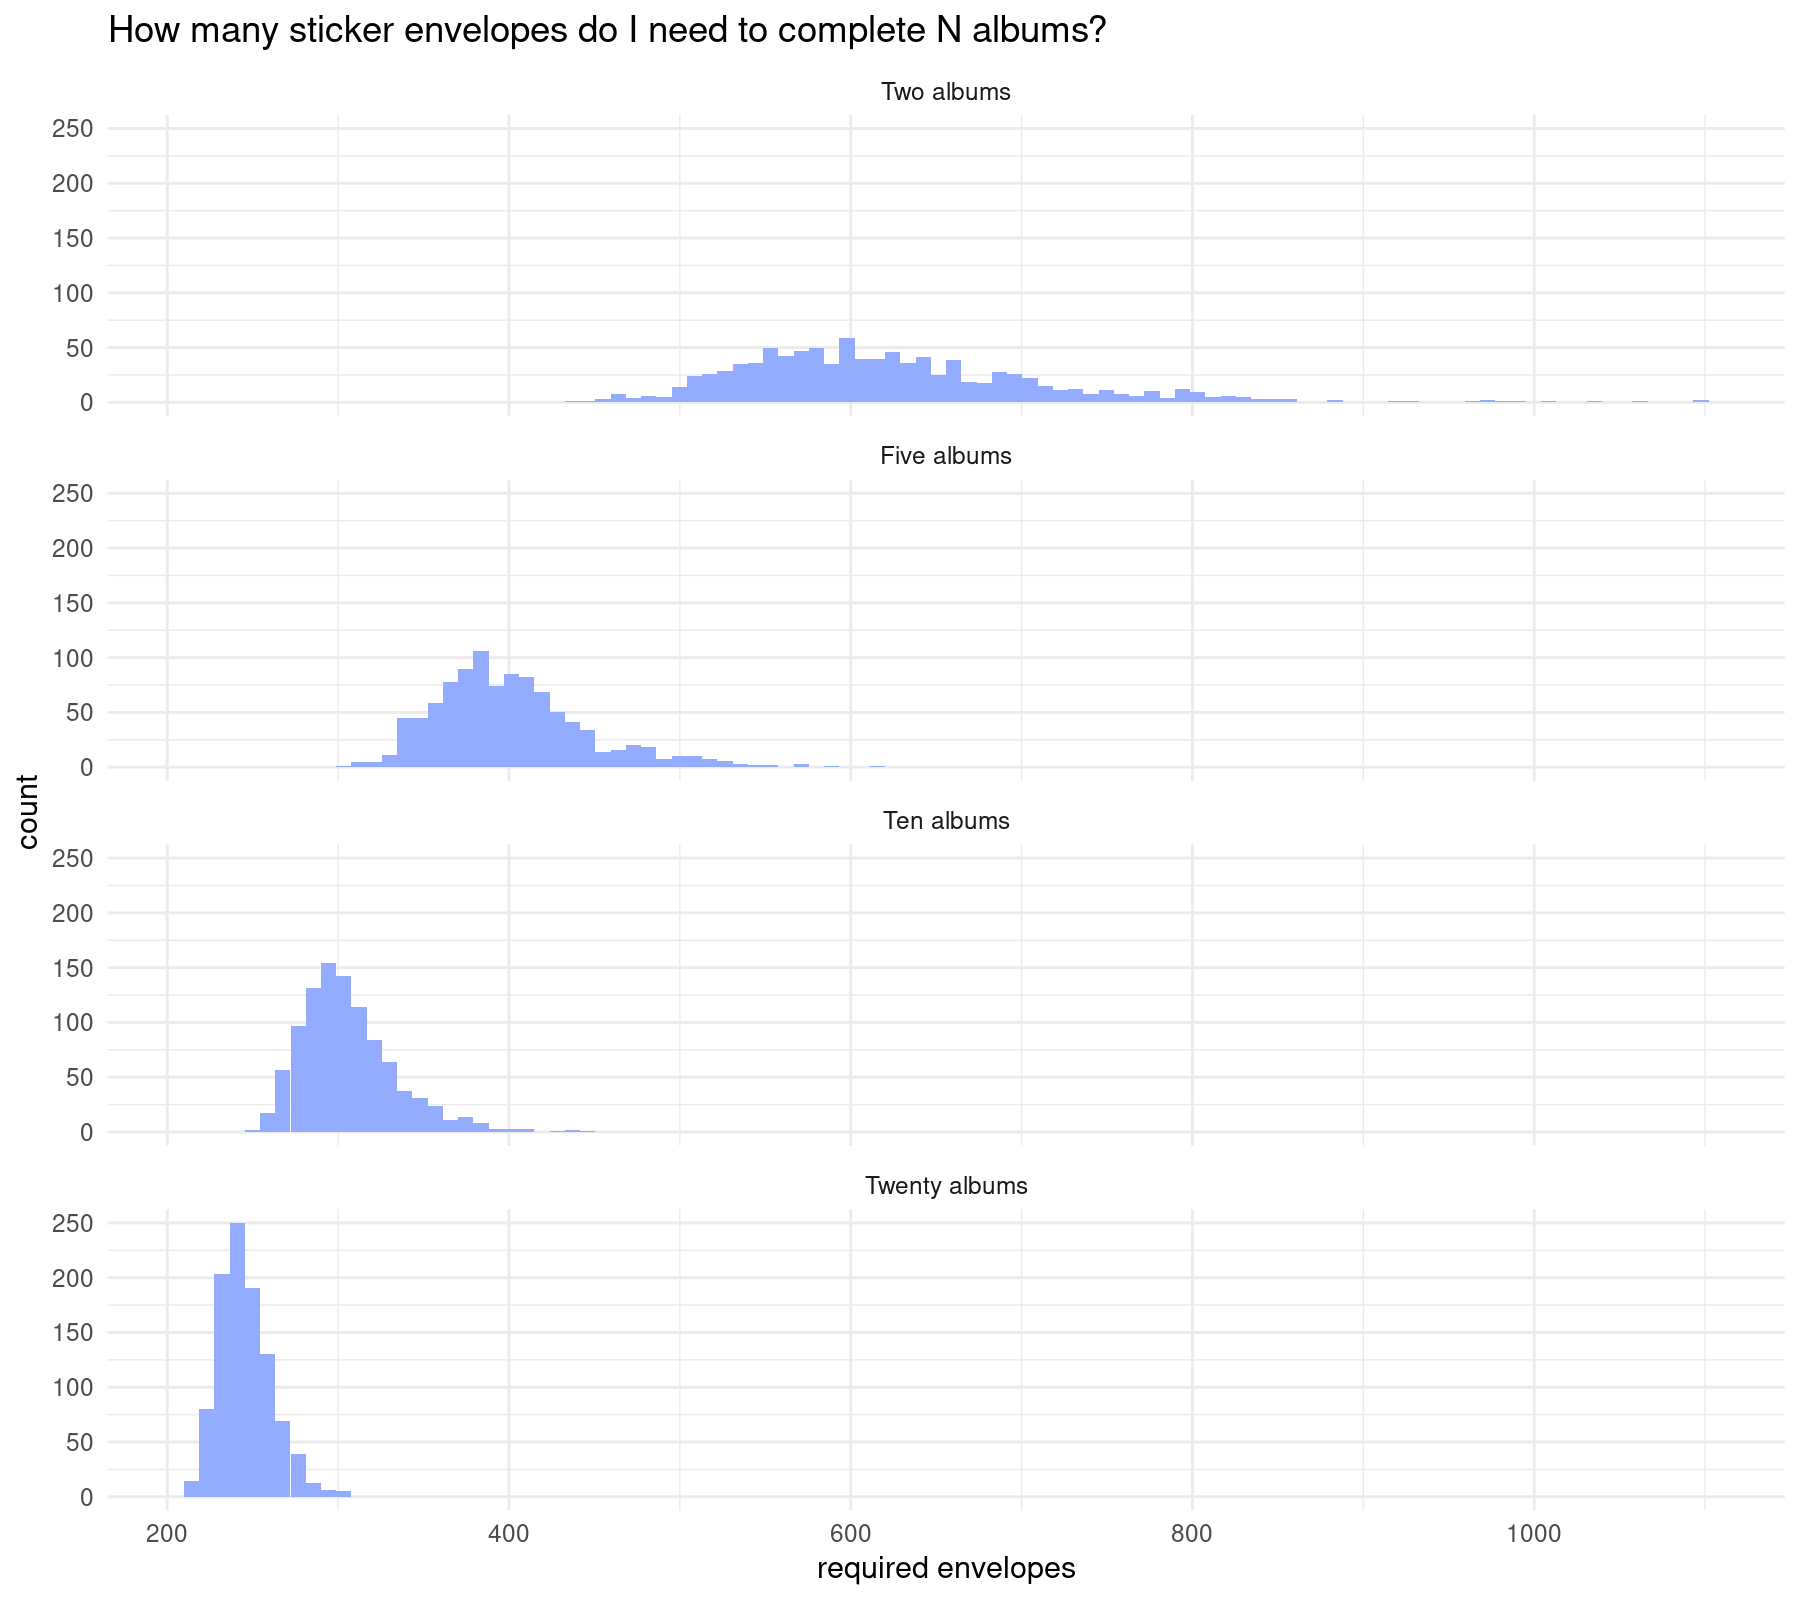
Now I create some histograms to see the result for different numbers of albums as in the original post:
simulation_results_4 <- tibble(
  required_envelopes = c(simulation_results_3[2,], simulation_results_3[5,], simulation_results_3[10,], simulation_results_3[20,]),
  n_albums = c(rep("Two albums", 1000), rep("Five albums", 1000), rep("Ten albums", 1000), rep("Twenty albums", 1000))
) %>%
  mutate(required_envelopes = required_envelopes / c(rep(2, 1000), rep(5, 1000), rep(10, 1000), rep(20, 1000)),
         n_albums = factor(n_albums, levels = c("Two albums", "Five albums", "Ten albums", "Twenty albums")))

simulation_results_4 %>%
  group_by(n_albums) %>%
  summarise(envelopes_per_album = mean(required_envelopes)) %>%
  mutate(envelopes_total = envelopes_per_album * c(2, 5, 10, 20))
# A tibble: 4 × 3
  n_albums      envelopes_per_album envelopes_total
  <fct>                       <dbl>           <dbl>
1 Two albums                   624.           1247.
2 Five albums                  401.           2007.
3 Ten albums                   306.           3062.
4 Twenty albums 246. 4913.ggplot(simulation_results_4, aes(x = required_envelopes)) +
geom_histogram(bins = 100, fill = "#94acff") +
labs(x = "required envelopes") +
theme_minimal() +
ggtitle("How many sticker envelopes do I need to complete N albums?") +
facet_wrap(~n_albums, ncol = 1)
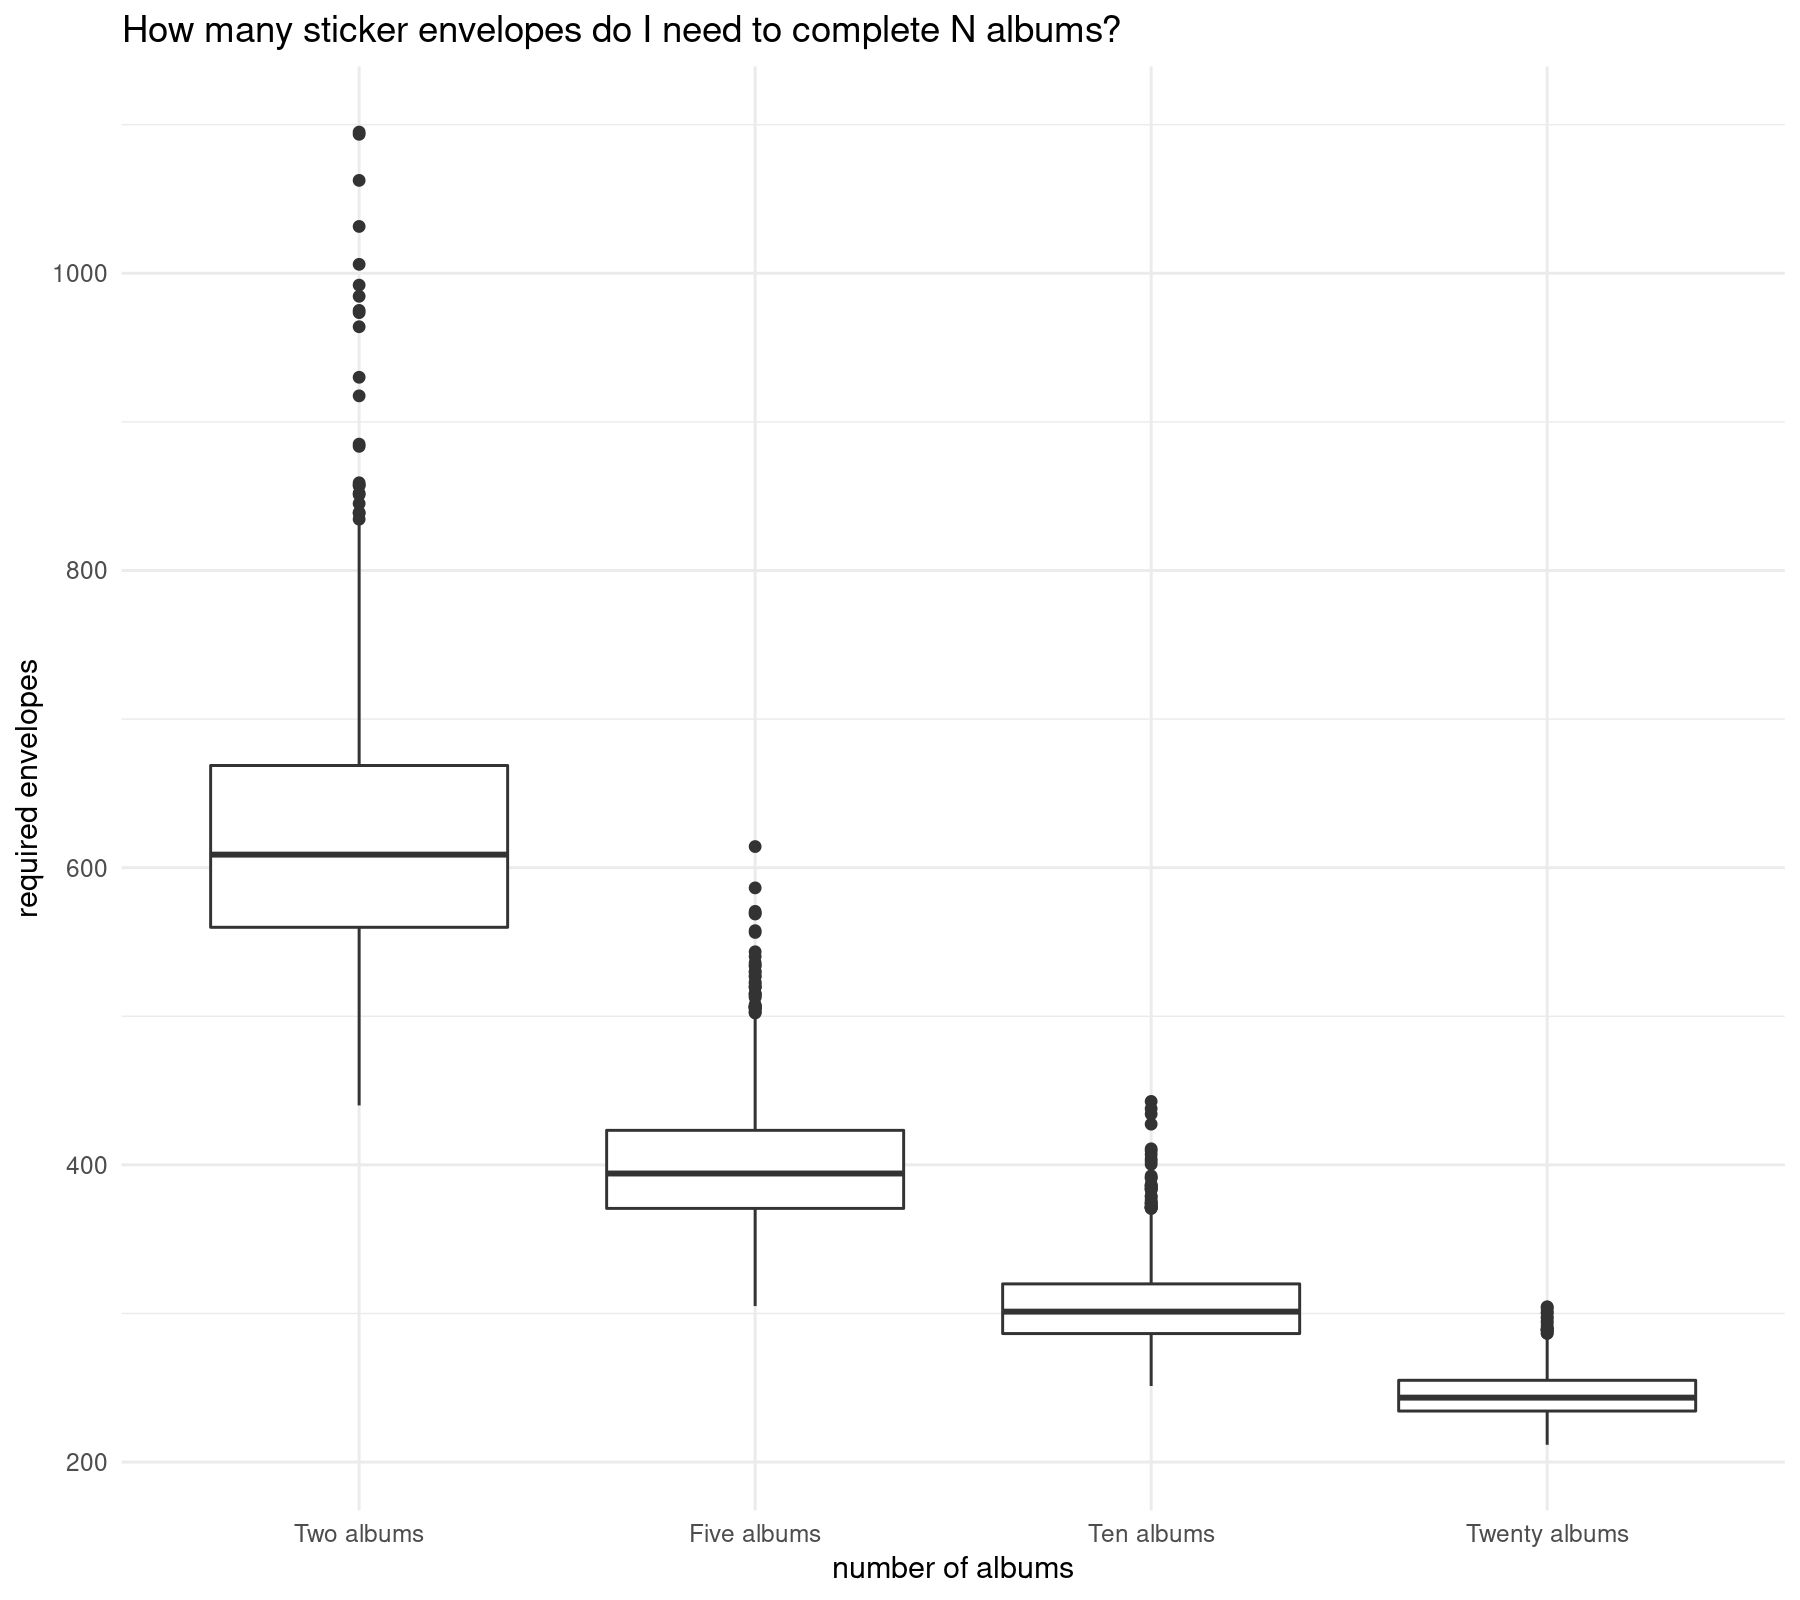
The largest the number of albums, the shortest the required sticker envelopes.
Another way to visualize this is by creating a boxplot:
ggplot(simulation_results_4, aes(x = n_albums, y = required_envelopes)) +
  geom_boxplot() +
  labs(x = "number of albums", y = "required envelopes") +
  theme_minimal() +
  ggtitle("How many sticker envelopes do I need to complete N albums?")
Concluding remarks
As observed, to complete one album I need around 940 sticker envelopes, but to complete twenty albums then around 4940 sticker envelopes are needed in total and around 250 sticker envelopes are needed for my album.
Its not about luck, its about having many friends (and having many friends is luck itself). Besides stickers exchange and adding fun to the process, completing the album with friends makes it cheaper to achieve.