Inserting images
Among the different image formats, it is possible to render images in a vignette as PNG or SVG.
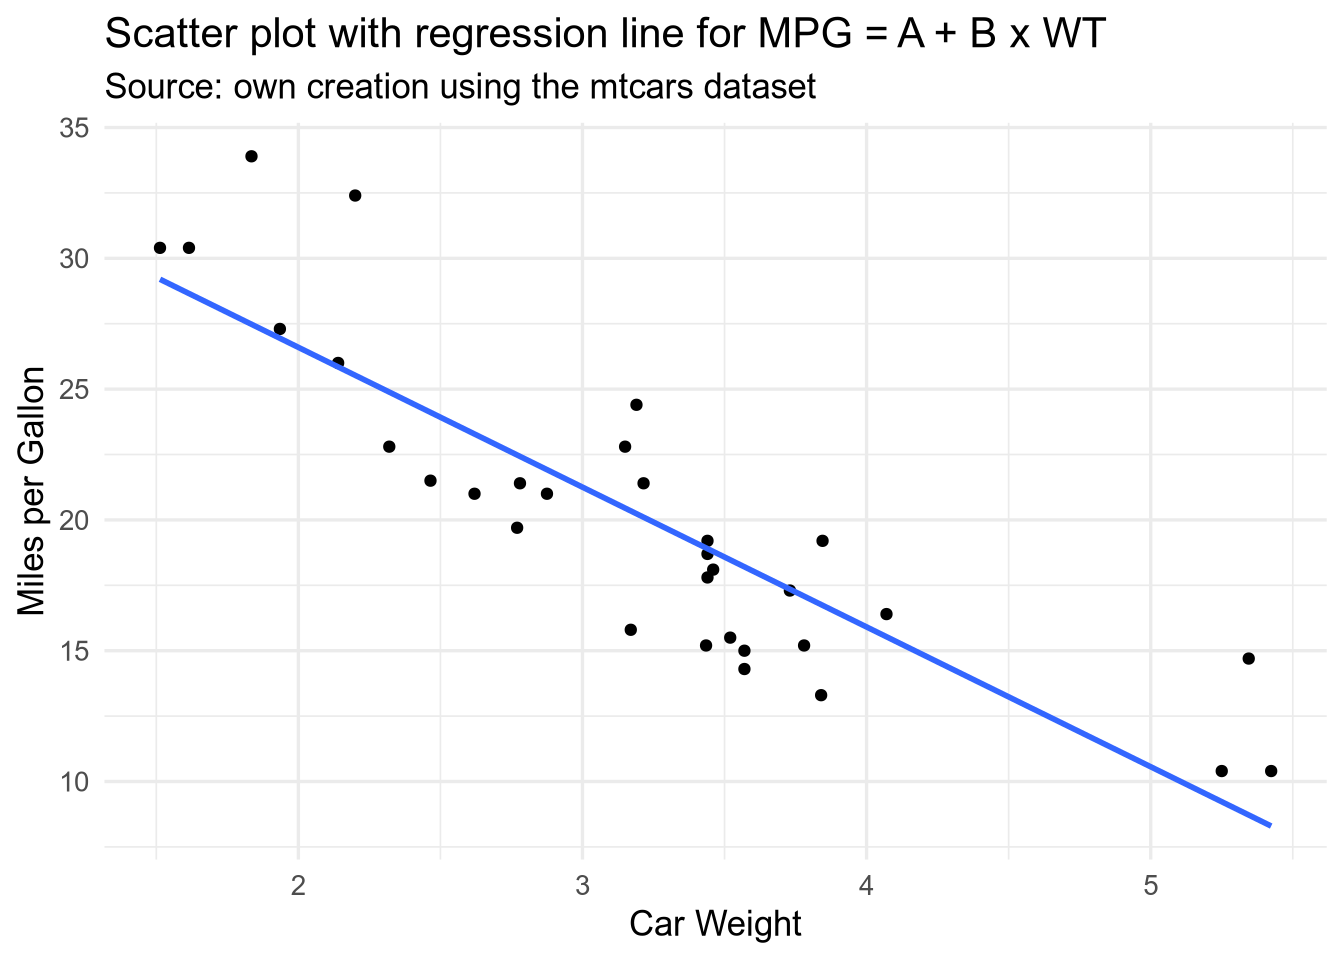
Here is an example of a rendered plot as PNG:
```{r plot1, echo = FALSE, message = FALSE, dev = "png", fig.ext = "png", eval = capabilities("cairo")}
library(ggplot2)

g <- ggplot(data = mtcars, aes(x = wt, y = mpg)) +
  geom_point() +
  geom_smooth(method = "lm", se = FALSE) +
  labs(
    title = "Scatter plot with regression line for MPG = A + B x WT",
    subtitle = "Source: own creation using the mtcars dataset",
    x = "Car Weight",
    y = "Miles per Gallon"
  ) +
  theme_minimal(base_size = 13)

g
```
The same plot rendered in SVG format:
```{r plot2, echo = FALSE, message = FALSE, dev = "svg", fig.ext = "svg", eval = capabilities("cairo")}
g
```