Ukmaps is growing and will become a “real” R package.
Because of delays with my scholarship payment, if this post is useful to you I kindly ask a minimal donation on Buy Me a Coffee that shall be used to continue my Open Source efforts. If you need an R package or Shiny dashboard for your team, you can email me or inquiry on Fiverr. The full explanation is here: A Personal Message from an Open Source Contributor
Continuing with the previous blog question ‘how can you plot a map of the UK with ggplot2?’
I started working more on ukmaps for easy plotting of administrative and electoral areas.
You can install the development version of ukmaps (v0.0.2) with:
remotes::install_github("pachadotdev/ukmaps")Examples
Yes/No map of London administrative areas
library(ukmaps)
library(dplyr)
library(ggplot2)

d <- administrative %>%
  mutate(is_london = if_else(region == "London", "Yes", "No"))

pal <- c("#165976", "#d04e66")

ggplot(d) +
  geom_sf(aes(fill = is_london, geometry = geometry), color = "white") +
  scale_fill_manual(values = pal, name = "Is this London?") +
  labs(title = "Map of England with Administrative Boundaries") +
  theme_minimal(base_size = 13)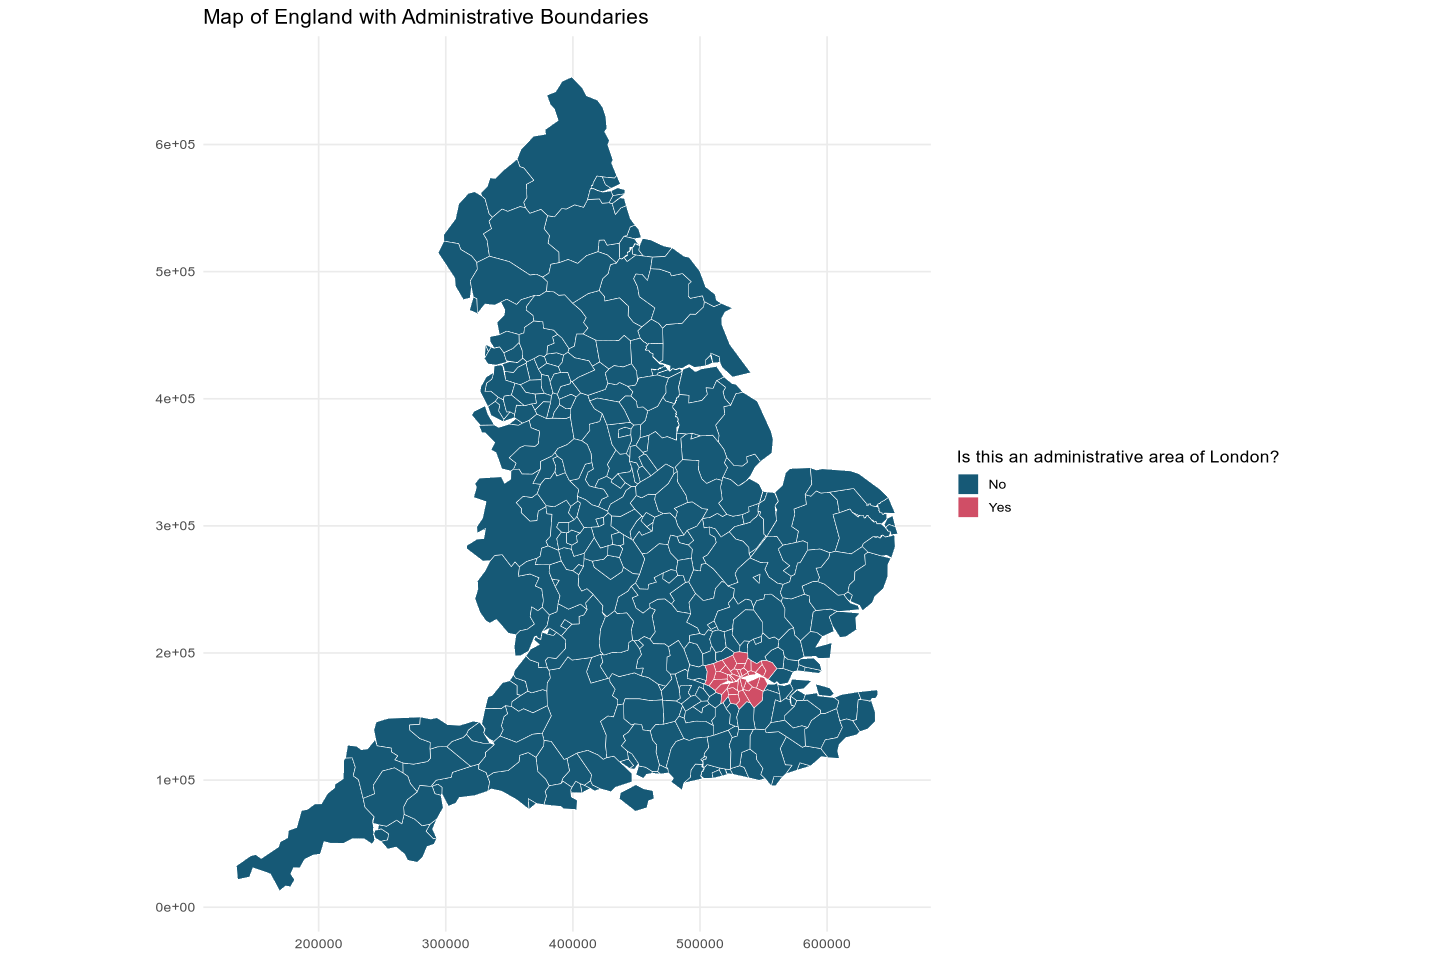
Country-level map of the UK
pal <- c("#165976", "#365158", "#d04e66", "#ffd613")

# country() aggregates the map to country level
ggplot(country()) +
  geom_sf(aes(fill = country, geometry = geometry), color = "white") +
  scale_fill_manual(values = pal, name = "Country") +
  labs(title = "Map of England with Country Boundaries") +
  theme_minimal(base_size = 13)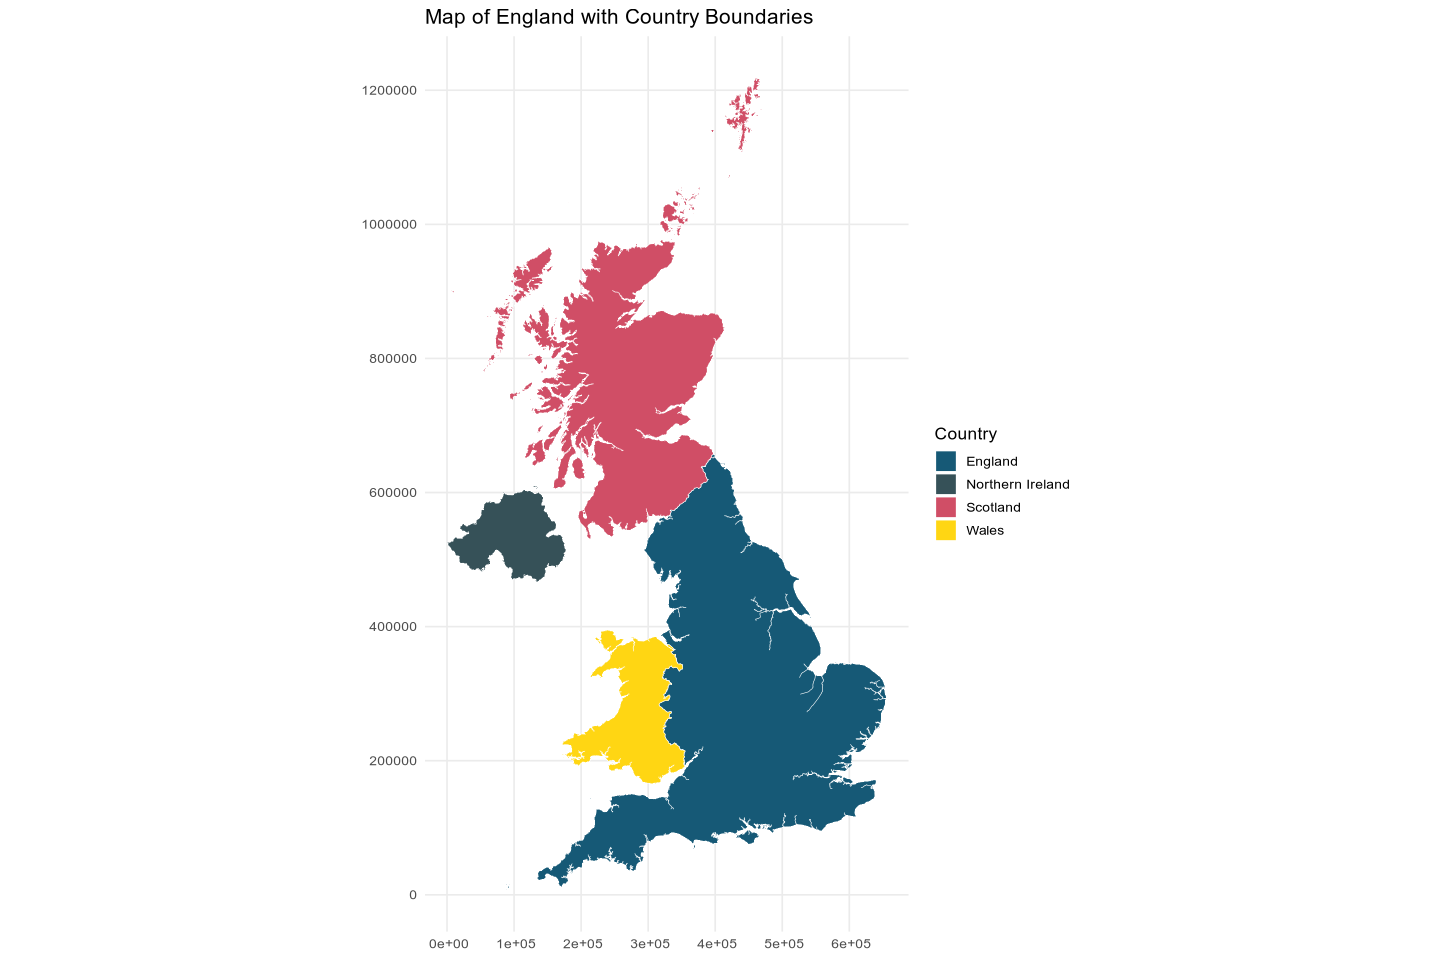
Which part of Barnet is Golders Green in?
d <- electoral %>%
  filter(lad_name == "Barnet" & boundary_type == "ward") %>%
  mutate(is_golders_green = if_else(area_name == "Golders Green", "Yes", "No"))

pal <- c("#165976", "#d04e66")

ggplot(d) +
  geom_sf(aes(fill = is_golders_green, geometry = geometry), color = "white") +
  scale_fill_manual(values = pal, name = "Is this Golders Green?") +
  labs(title = "Map of Barnet (London) with Electoral Boundaries") +
  theme_minimal(base_size = 13)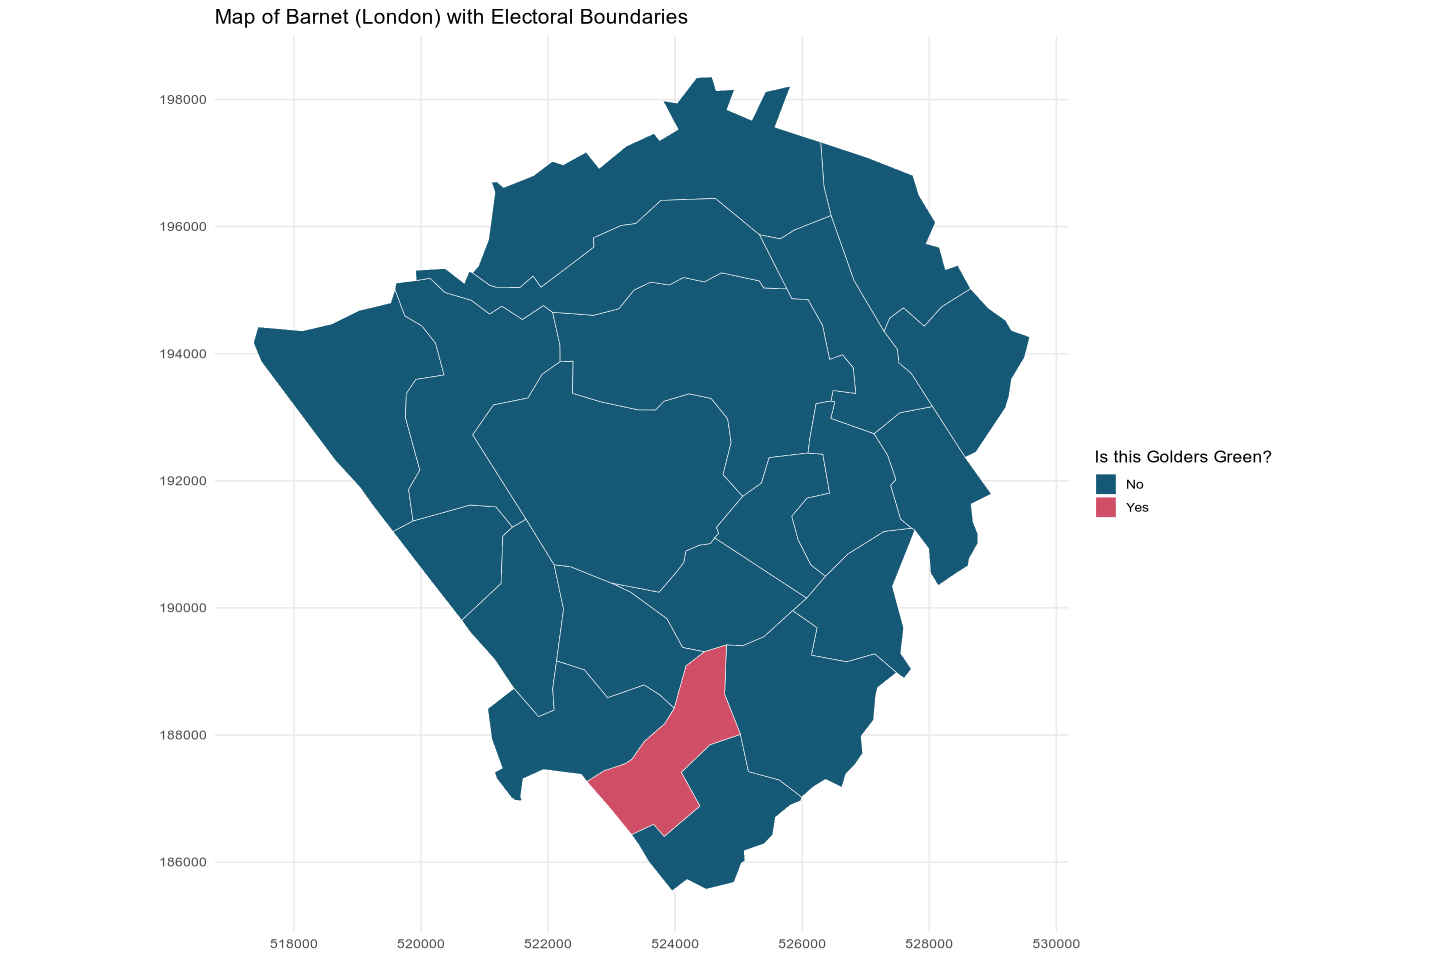
I will improve the datasets soon to allow filtering by city and more.
I hope this is useful :)