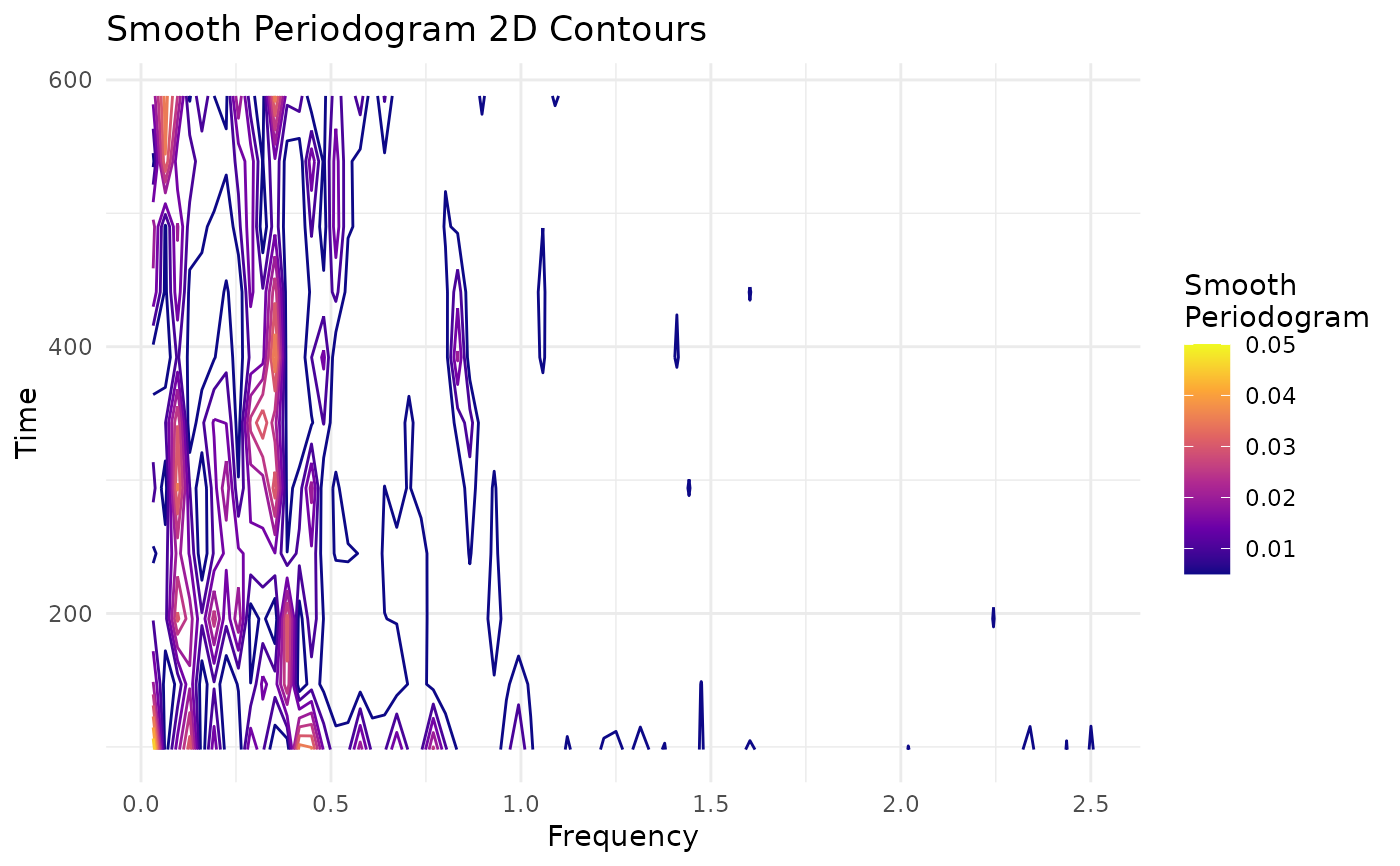
Plots the contour plot of the smoothing periodogram of a time series, by blocks or windows.
block.smooth.periodogram(
  y,
  x = NULL,
  N = NULL,
  S = NULL,
  p = 0.25,
  spar.freq = 0,
  spar.time = 0
)
Arguments
- y
(type: numeric) data vector
- x
(type: numeric) optional vector, if
x = NULLthen the function uses \((1,\ldots,n)\) wherenis the length ofy.- N
(type: numeric) value corresponding to the length of the window to compute periodogram. If
N=NULLthen the function will use \(N = \textrm{trunc}(n^{0.8})\), see Dahlhaus and Giraitis (1998) where \(n\) is the length of theyvector.- S
(type: numeric) value corresponding to the lag with which will be taking the blocks or windows to calculate the periodogram.
- p
(type: numeric) value used if it is desired that
Sis proportional toN. By defaultp=0.25, ifSandNare not entered.- spar.freq
(type: numeric) smoothing parameter, typically (but not necessarily) in \((0,1]\).
- spar.time
(type: numeric) smoothing parameter, typically (but not necessarily) in \((0,1]\).
Value
A ggplot object.
Details
The number of windows of the function is \(m = \textrm{trunc}((n-N)/S+1)\),
where trunc truncates de entered value and n is
the length of the vector y. All windows are of the same length
N, if this value isn't entered by user then is computed as
\(N=\textrm{trunc}(n^{0.8})\) (Dahlhaus).
LSTS_spb computes the periodogram in each of the
M windows and then smoothes it two times with
smooth.spline function; the first time using
spar.freq parameter and the second time with spar.time. These
windows overlap between them.
References
For more information on theoretical foundations and estimation methods see Dahlhaus R, others (1997). “Fitting time series models to nonstationary processes.” The annals of Statistics, 25(1), 1--37. Dahlhaus R, Giraitis L (1998). “On the optimal segment length for parameter estimates for locally stationary time series.” Journal of Time Series Analysis, 19(6), 629--655.
See also
Examples
block.smooth.periodogram(malleco)
#> Warning: `stat(level)` was deprecated in ggplot2 3.4.0.
#> ℹ Please use `after_stat(level)` instead.
#> ℹ The deprecated feature was likely used in the LSTS package.
#>   Please report the issue at <https://github.com/pachamaltese/LSTS/issues/>.