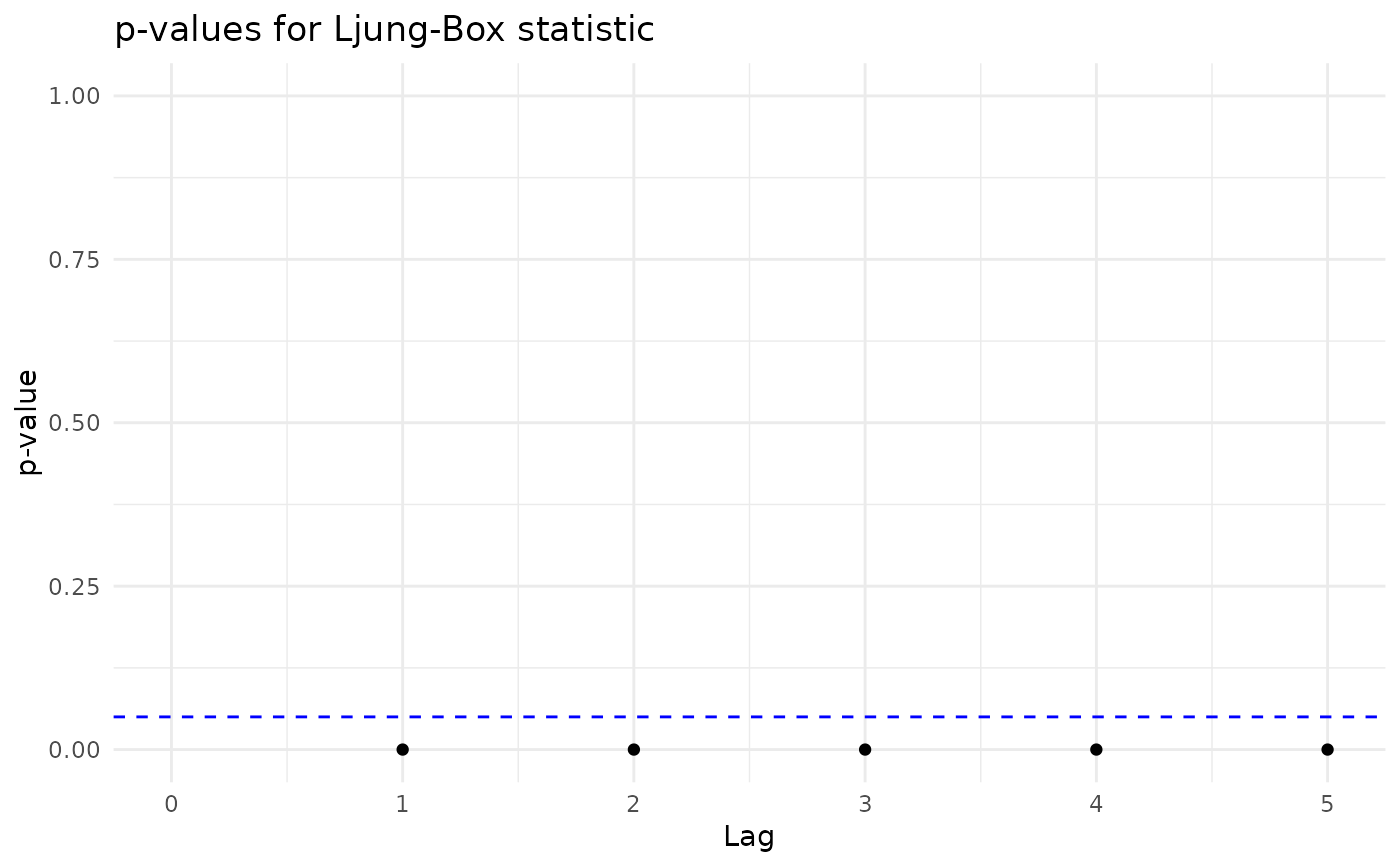
Plots the p-values Ljung-Box test.
Box.Ljung.Test(z, lag = NULL, main = NULL)Arguments
- z
(type: numeric) data vector
- lag
(type: numeric) the number of periods for the autocorrelation
- main
(type: character) a title for the returned plot
Value
A ggplot object.
Details
The Ljung-Box test is used to check if exists autocorrelation in a time
series. The statistic is
$$q = n(n+2)\cdot\sum_{j=1}^h \hat{\rho}(j)^2/(n-j)$$ with n the
number of observations and \(\hat{\rho}(j)\) the autocorrelation
coefficient in the sample when the lag is j. LSTS_lbtp
computes \(q\) and returns the p-values graph with lag j.
References
For more information on theoretical foundations and estimation methods see Brockwell PJ, Davis RA, Calder MV (2002). Introduction to time series and forecasting, volume 2. Springer. Ljung GM, Box GE (1978). “On a measure of lack of fit in time series models.” Biometrika, 65(2), 297--303.
See also
Examples
Box.Ljung.Test(malleco, lag = 5)